
-
Federal
NCDC Storm Events Database
National Oceanic and Atmospheric Administration, Department of Commerce —
Storm Data is provided by the National Weather Service (NWS) and contain statistics on personal injuries and damage estimates. Storm Data covers the United States of... -
Federal
NASA Earth Observatory Images
National Aeronautics and Space Administration —
The Earth Observatory is part of the EOS Project Science Office located at NASA Goddard Space Flight Center. -
City
Heat Vulnerability Index Rankings
City of New York —
The Heat Vulnerability Index (HVI) shows neighborhoods whose residents are more at risk for dying during and immediately following extreme heat. It uses a... -
Federal
Industrial Facility Combustion Energy Use
Department of Energy —
Facility-level industrial combustion energy use is calculated from greenhouse gas emissions data reported by large emitters (>25,000 metric tons CO2e per year)... -
Federal
Heat Wave Characteristics in 50 Large U.S. Cities, 1961–2023
U.S. Environmental Protection Agency —
These maps show changes in the number of heat waves per year (frequency); the average length of heat waves in days (duration); the number of days between the first... -
Federal
Landsat 2000
National Aeronautics and Space Administration —
Landsat.org, an affiliate of the Tropical Rain Forest Information Center (TRFIC), now hosts the Global Orthorectified Landsat Datasets for four epochs: 1970's MSS,... -
Federal
Data for Temperature-dependent composition of summertime PM2.5 in observations and model predictions across the Eastern U.S
U.S. Environmental Protection Agency —
Total fine particle mass (pm25), organic carbon fine particle mass (oc), sulfate fine particle mass (so4), and sulfur dioxide gas (so2) observed EPA AQS sites (ob)... -
State
Indicators of Climate Change in California
State of California —
An introduction to the 2022 Indicators of Climate Change in California Report. The Indicators of Climate Change in California report documents observed changes in the... -
Federal
Fallon FORGE: Well Data, Geophysical Data, and Geologic Maps
Department of Energy —
The data is associated to the Fallon FORGE project and includes mudlogs for all wells used to characterize the subsurface, as wells as gravity, magnetotelluric,... -
Federal
B01 SBE16 - CTD Transmissivity
National Oceanic and Atmospheric Administration, Department of Commerce —
Ocean observation data from the Northeastern Regional Association of Coastal & Ocean Observing Systems (NERACOOS). The NERACOOS region includes the northeast... -
Federal
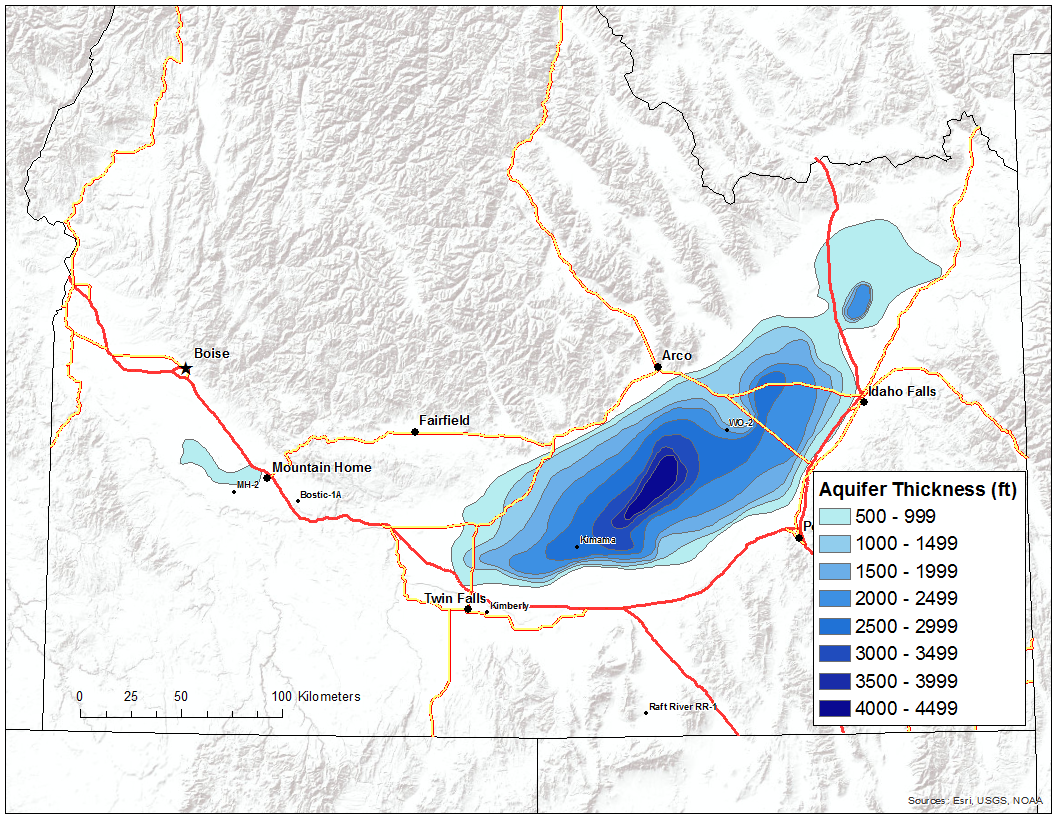
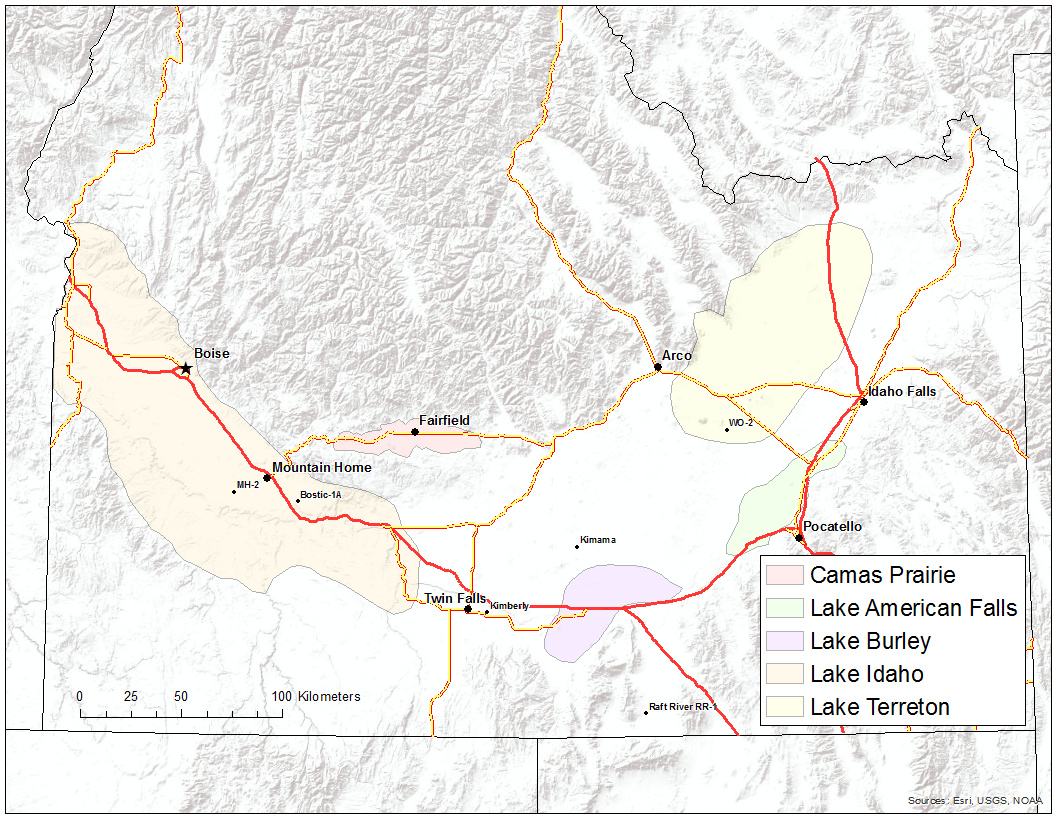
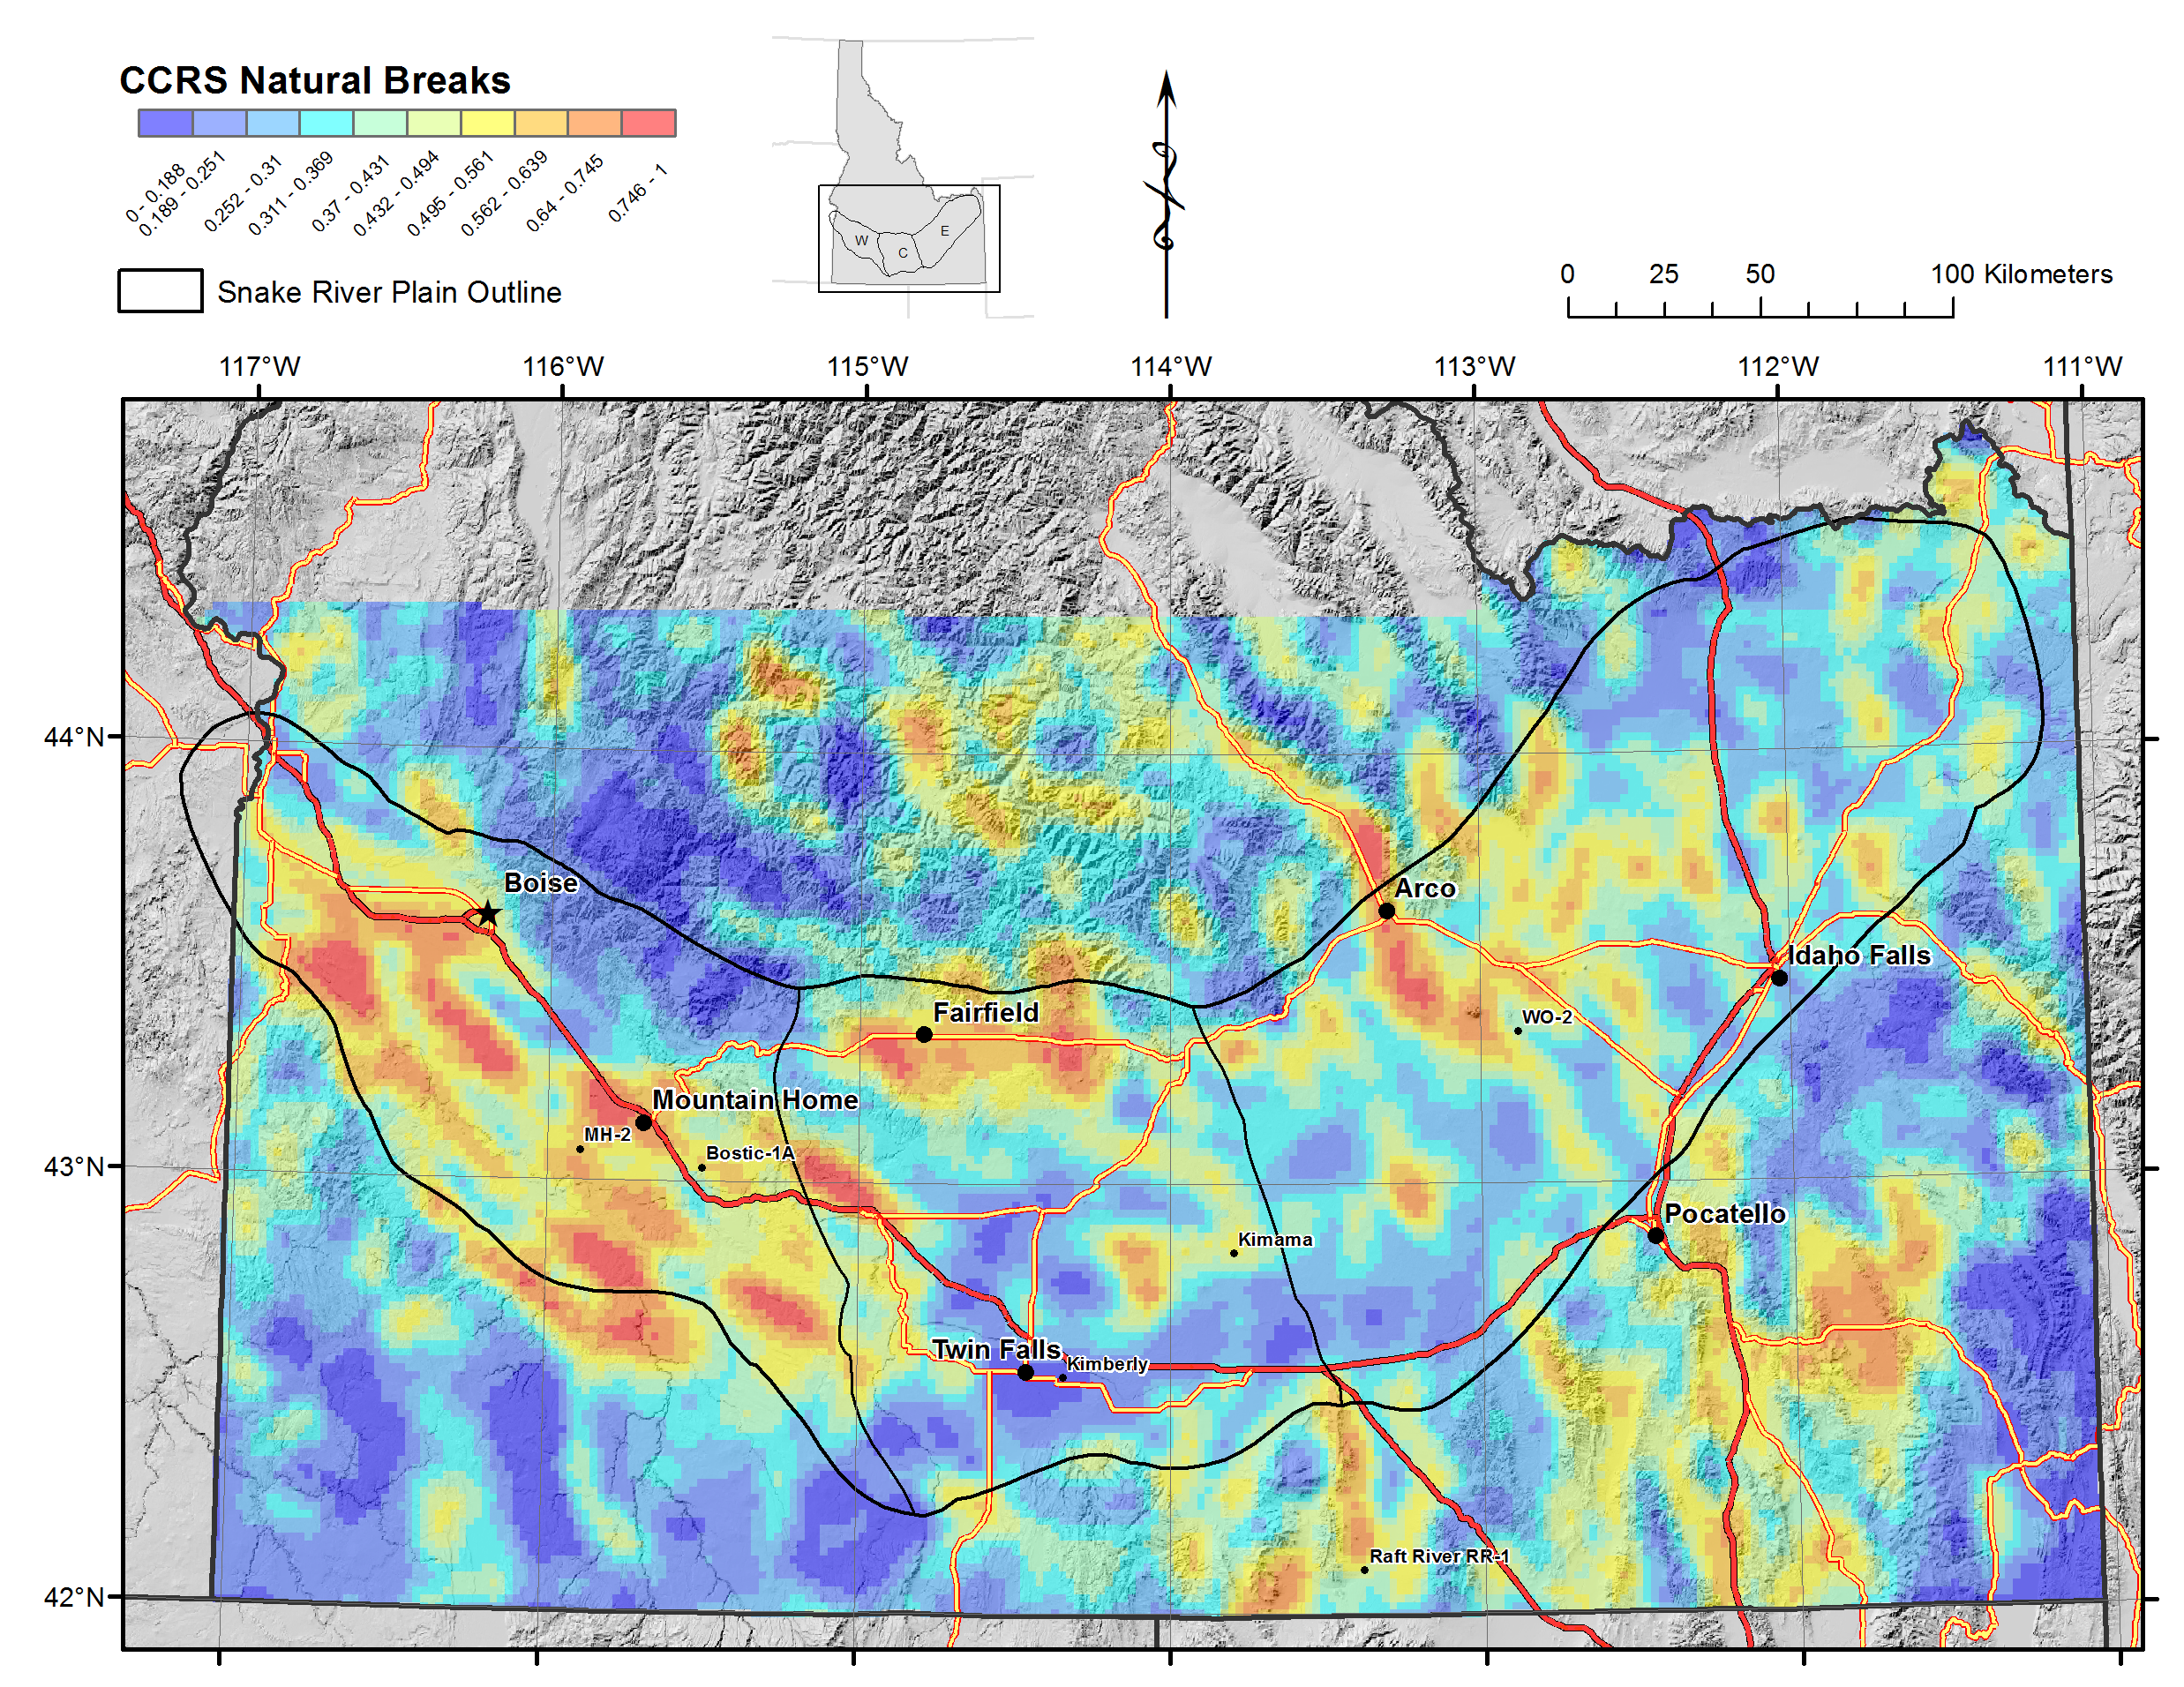
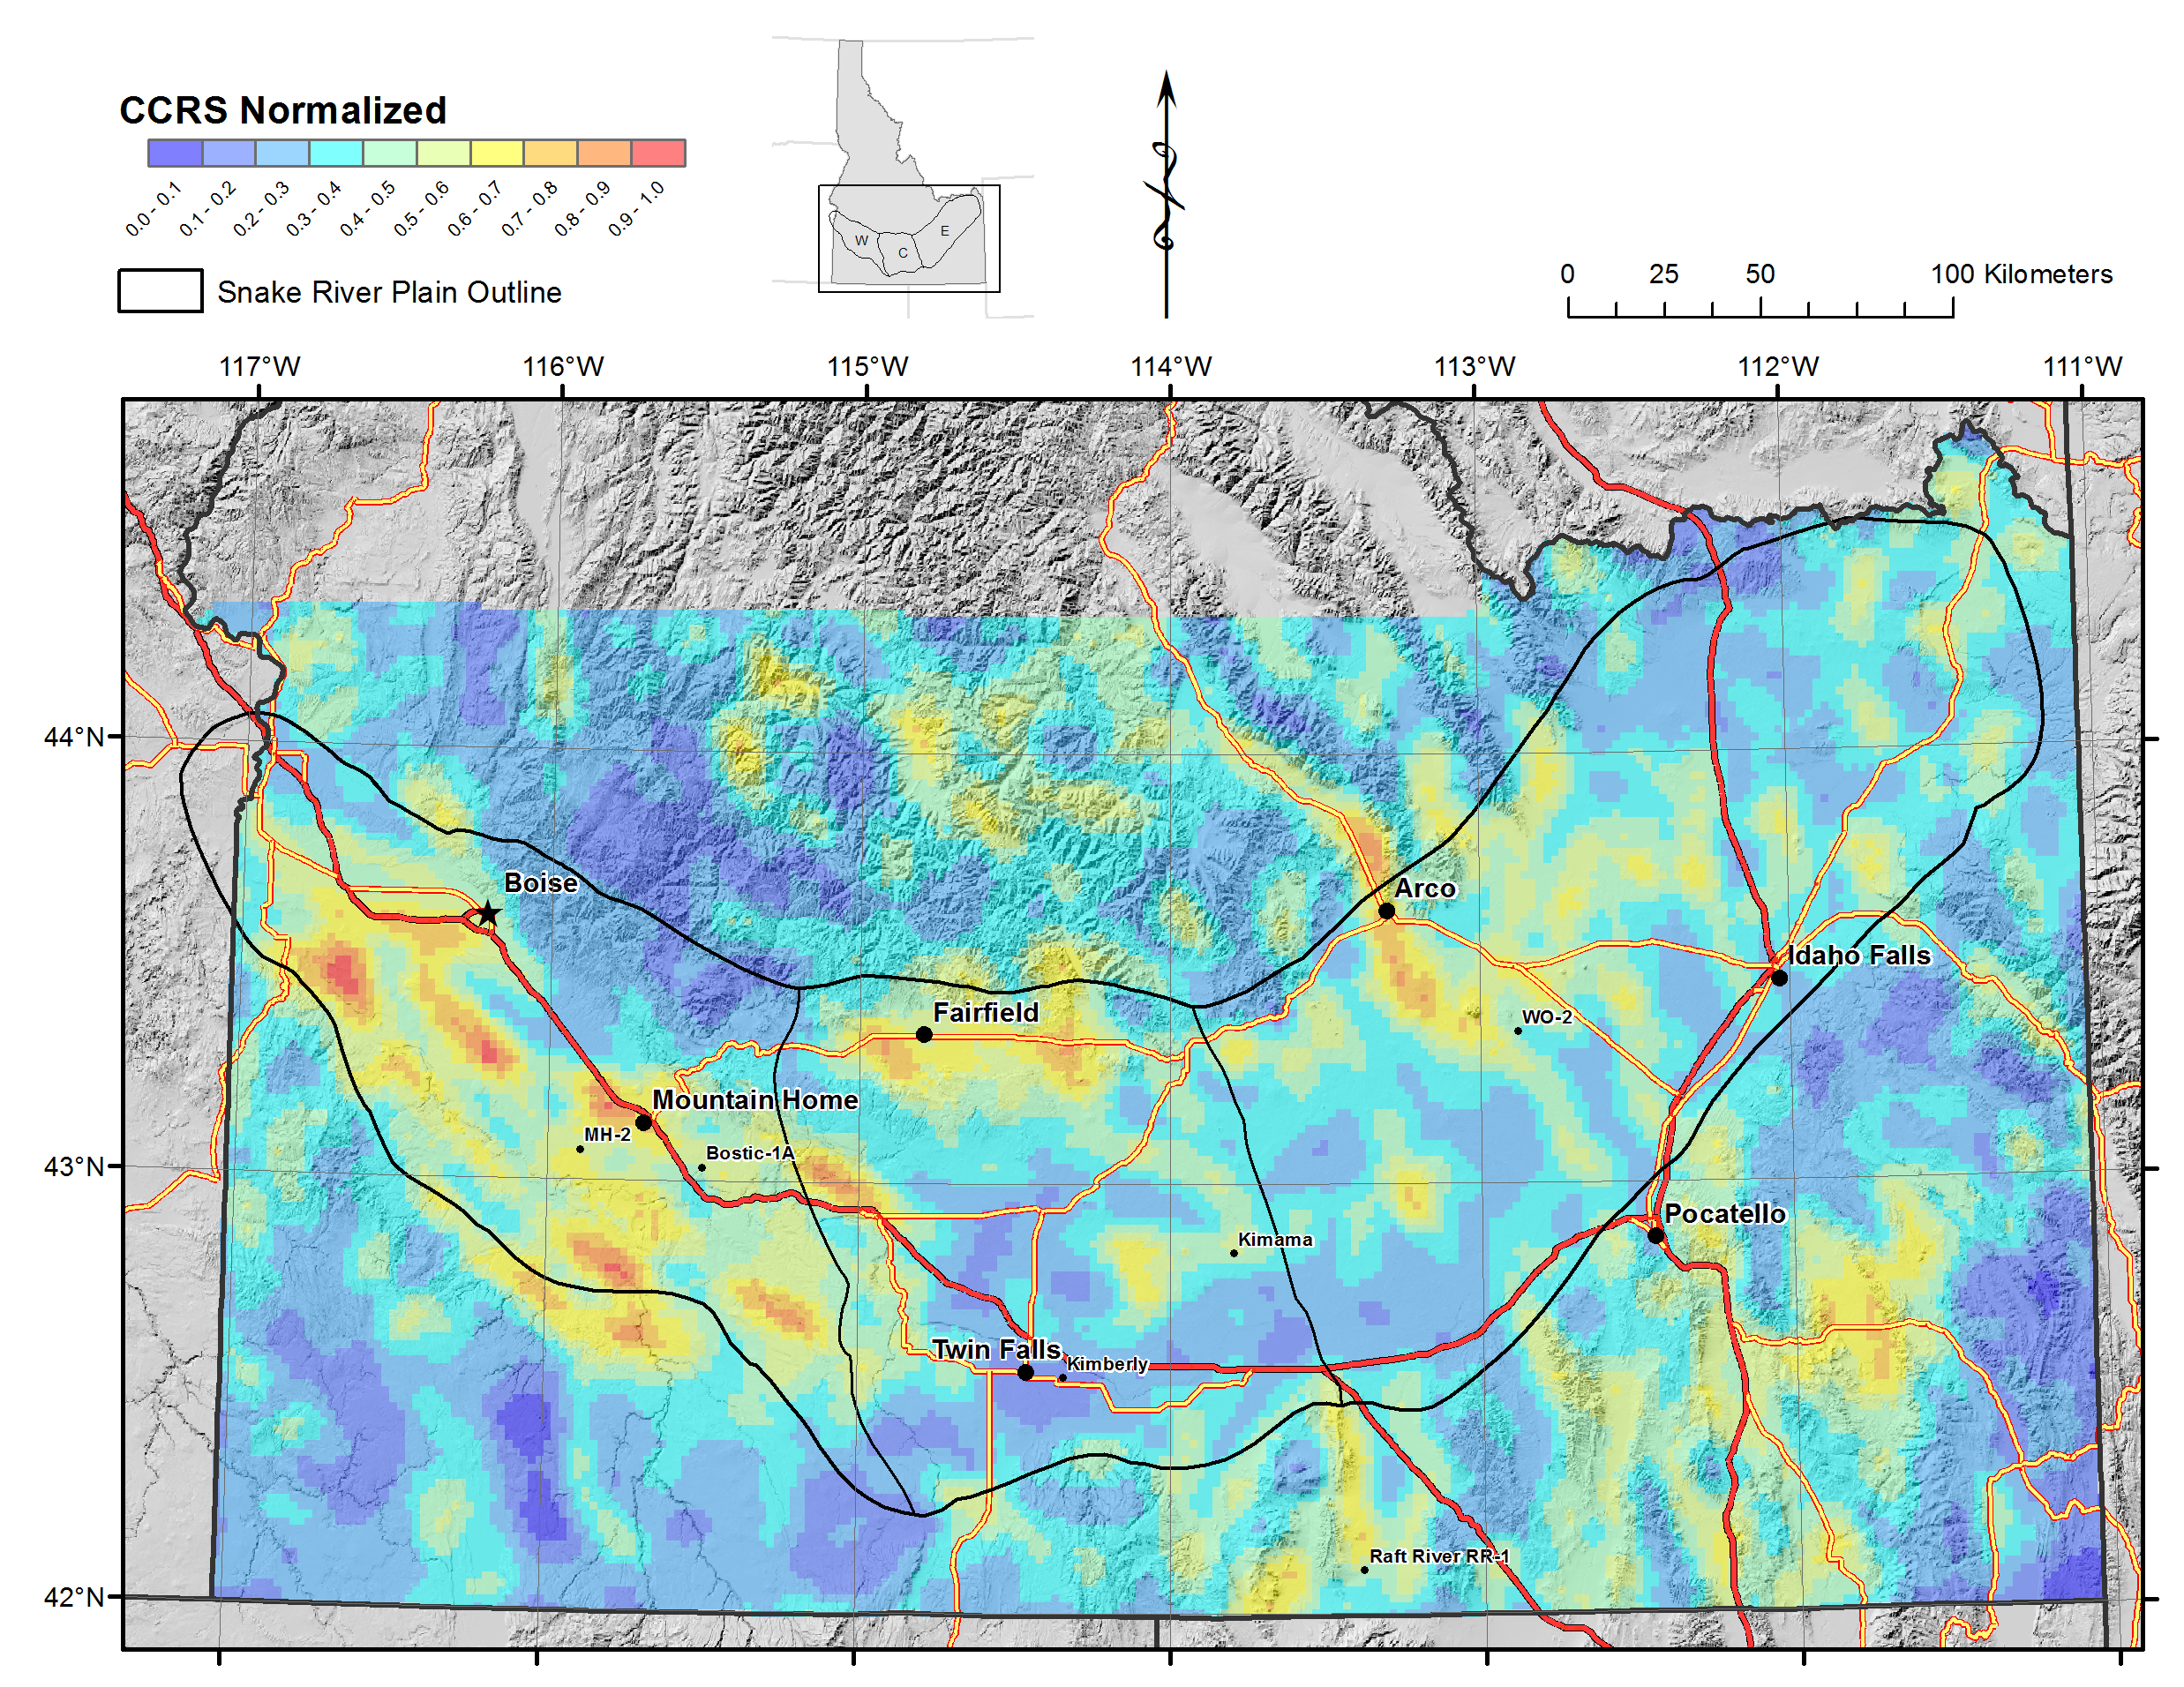
Snake River Plain Geothermal Play Fairway Analysis Heat, Permeability, and Seal CRS Map Raster Files
Department of Energy —
Snake River Plain Play Fairway Analysis - Phase 1 CRS Raster Files. This dataset contains raster files created in ArcGIS. These raster images depict Common Risk... -
Federal
C-HARM v2 Nowcast, Pseudo-nitzschia, cellular domoic acid, and particular domoic acid probability, California and Southern Oregon coast, 2022-present
National Oceanic and Atmospheric Administration, Department of Commerce —
The C-HARM model generates nowcast and forecasts of the probability of Pseudo-nitzschia concentrations of in excess of 10,000 cells/L, the probability of particulate... -
Federal
NOAA ZCTA-level daily NC weather data (2009-2021)
U.S. Environmental Protection Agency —
This data contains daily, ZCTA-level records of five meteorological variables: mean temperature, maximum temperature, minimum temperature, relative humidity, and... -
Federal
Meteorology, physical oceanography, transport of water, biogeochemistry, and other parameters collected at fixed locations in the open ocean from the OceanSITES network
National Oceanic and Atmospheric Administration, Department of Commerce —
This collection comprises data covering meteorology, physical oceanography, transport of water, biogeochemistry, and parameters relevant to the carbon cycle, ocean... -
City
Hyperlocal Temperature Monitoring
City of New York —
As a part of the Cool Neighborhoods Initiative, the NYC Parks Department, Mayor’s Office of Resilience and NYC Department of Health and Mental Hygiene monitored... -
Federal
Climate Change Pressures Heat Zones Mean Days Over 30 Degrees Celsius Historical 1980-2009 (Image Service)
Department of Agriculture —
Heat Zones map the distribution of potential heat stress for plants and animals, including humans. Heat zones, defined as the number of days per year with maximum... -
Federal
Long-term gas and heat emissions measurements, Norris Geyser Basin, Yellowstone National Park
Department of the Interior —
We installed an eddy covariance station on July 10, 2018 at Bison Flat, an acid-sulfate, vapor-dominated area (0.04-km2) in Norris Geyser Basin, Yellowstone National... -
Federal
TAO/TRITON, RAMA, and PIRATA Buoys, Monthly, 1980-present, Heat Content
National Oceanic and Atmospheric Administration, Department of Commerce —
This dataset has monthly Heat Content data from the TAO/TRITON (Pacific Ocean, https://www.pmel.noaa.gov/gtmba/ ), RAMA (Indian Ocean,...

Official websites use .gov
A
.gov website belongs to an official government
organization in the United States.
Secure .gov websites use HTTPS
A
lock (
) or https:// means you’ve safely connected to
the .gov website. Share sensitive information only on official,
secure websites.