NOAA Climate Data Record (CDR) of SSM/I and SSMIS Microwave Brightness Temperatures, RSS Version 7
Access & Use Information
Downloads & Resources
-
NCEI Dataset Landing Page
Landing page for the dataset.
-
NOAA CDR page
Access to the published CDR product, documentation and source code.
-
NCEI Direct Download
Direct download for dataset files.
-
NCEI THREDDS CatalogHTML
THREDDS Data Service for this dataset.
-
NCEI Archive Information Request System (AIRS)
Search the data archive and submit an order for the dataset via the interface.
-
Registry of Open Data on AWS
Information on AWS data access.
-
AWS S3 Explorer (Region: us-east-1)HTML
Browse view to explore the S3 bucket.
-
Azure Landing Page (Region: us-east)HTML
Information on Microsoft Azure data access.
-
CDR Program Contacts
Contact information for the CDR Program.
-
Global Change Master Directory (GCMD) Keywords
The information provided on this page seeks to define how the GCMD Keywords...
-
Global Change Master Directory (GCMD) Keywords
The information provided on this page seeks to define how the GCMD Keywords...
-
Global Change Master Directory (GCMD) Keywords
The information provided on this page seeks to define how the GCMD Keywords...
-
Global Change Master Directory (GCMD) Keywords
The information provided on this page seeks to define how the GCMD Keywords...
-
Global Change Master Directory (GCMD) Keywords
The information provided on this page seeks to define how the GCMD Keywords...
-
Global Change Master Directory (GCMD) Keywords
The information provided on this page seeks to define how the GCMD Keywords...
-
DSMR Publication at the NOAA Institutional Repository
Report documenting the Scientific Data Stewardship Maturity for this dataset.
-
DSMR Publication at the NOAA Institutional Repository
Report documenting the Scientific Data Stewardship Maturity for this dataset.
-
NOAA Climate Data Record (CDR) of SSM/I and...
Landing page for dataset.
Dates
| Metadata Date | August 10, 2023 |
|---|---|
| Metadata Created Date | October 28, 2022 |
| Metadata Updated Date | September 19, 2023 |
| Reference Date(s) | August 22, 2013 (publication) |
| Frequency Of Update | monthly |
Metadata Source
- ISO-19139 ISO-19139 Metadata
Harvested from ncdc
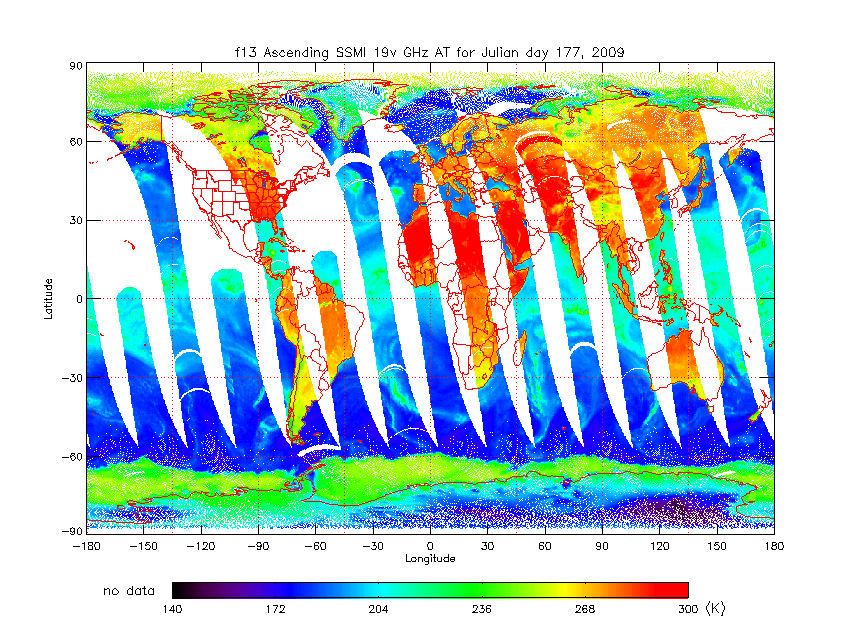
Graphic Preview

Additional Metadata
| Resource Type | Dataset |
|---|---|
| Metadata Date | August 10, 2023 |
| Metadata Created Date | October 28, 2022 |
| Metadata Updated Date | September 19, 2023 |
| Reference Date(s) | August 22, 2013 (publication) |
| Responsible Party | DOC/NOAA/NESDIS/NCEI > National Centers for Environmental Information, NESDIS, NOAA, U.S. Department of Commerce (Point of Contact) |
| Contact Email | |
| Guid | gov.noaa.ncdc:C00810 |
| Category Tag 16E15F51 D96E 4051 9124 75665Abdc6Ff | ["Water"] |
| Access Constraints | Cite as: Frank J. Wentz, Carl A. Mears, and NOAA CDR Program (2013): NOAA Climate Data Record (CDR) of SSM/I and SSMIS Microwave Brightness Temperatures, RSS Version 7. [indicate subset used]. NOAA National Centers for Environmental Information. doi:10.7289/V5SJ1HKZ [access date]., Distribution liability: NOAA and NCEI make no warranty, expressed or implied, regarding these data, nor does the fact of distribution constitute such a warranty. NOAA and NCEI cannot assume liability for any damages caused by any errors or omissions in these data. If appropriate, NCEI can only certify that the data it distributes are an authentic copy of the records that were accepted for inclusion in the NCEI archives., Use liability: NOAA and NCEI cannot provide any warranty as to the accuracy, reliability, or completeness of furnished data. Users assume responsibility to determine the usability of these data. The user is responsible for the results of any application of this data for other than its intended purpose. |
| Bbox East Long | 180.0 |
| Bbox North Lat | 90.0 |
| Bbox South Lat | -90.0 |
| Bbox West Long | -180.0 |
| Coupled Resource | |
| Frequency Of Update | monthly |
| Graphic Preview Description | SSM/I Ascending 19 Vertical GHz Antenna Temperature |
| Graphic Preview File | https://www.ncei.noaa.gov/pub/data/metadata/images/f13_ssmi_tdr_ascending_19V.png |
| Graphic Preview Type | PNG |
| Harvest Object Id | 92403e12-d089-4a24-9240-e30a82134a4f |
| Harvest Source Id | 2cb3ef77-1683-4c2a-9119-dc65e50917c6 |
| Harvest Source Title | ncdc |
| Licence | For a complete description of use limitations for this CDR, see the Algorithm Theoretical Basis Document. |
| Lineage | The data were produced by Remote Sensing Systems (RSS) and are archived at the NOAA National Centers for Environmental Information (NCEI). |
| Metadata Language | eng; USA |
| Metadata Type | geospatial |
| Old Spatial | {"type": "Polygon", "coordinates": [[[-180.0, -90.0], [180.0, -90.0], [180.0, 90.0], [-180.0, 90.0], [-180.0, -90.0]]]} |
| Progress | onGoing |
| Spatial Data Service Type | |
| Spatial Reference System | |
| Spatial Harvester | True |
| Temporal Extent Begin | 1987-07-09 |
Didn't find what you're looking for? Suggest a dataset here.

