

Get a related visualization
URL: https://daac.ornl.gov/VEGETATION/guides/Global_Maps_C_Density_2010_Fig1.jpg
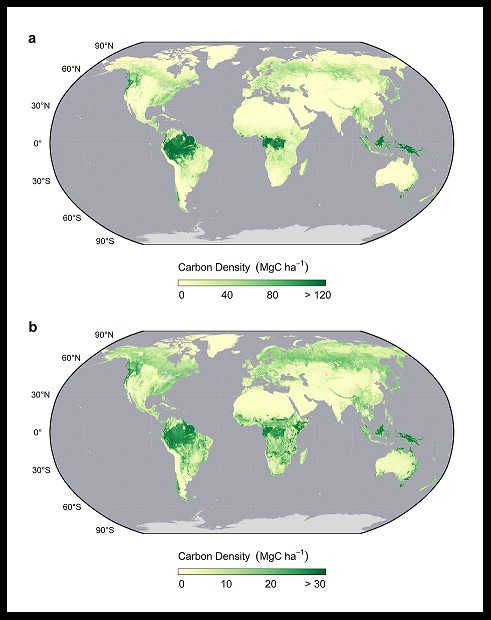
Global maps of above and belowground biomass carbon density. Upper figure is aboveground biomass carbon density and lower is belowground biomass carbon density. From Spawn et al. (In Review).
Source: Global Aboveground and Belowground Biomass Carbon Density Maps for the Year 2010
About this Resource
| Last updated | unknown |
|---|---|
| Created | unknown |
| Name | Get a related visualization |
| Format | JPEG Image File |
| License | License not specified |
| Created | 1 year ago |
| Media type | image/jpeg |
| has views | True |
| id | 1f00cebf-1dae-45a7-a230-2db87a1e310a |
| metadata modified | 1 year ago |
| package id | 76df998c-670e-4256-b187-1ba1fba659f4 |
| position | 5 |
| state | active |