

973 datasets found for ""Grid Cells""
-
Federal
EnviroAtlas - PRISM 30-Year Normal Annual Precipitation and Minimum and Maximum Temperature for the Contiguous US (1991–2020)
U.S. Environmental Protection Agency —
This annual data was accessed from the PRISM project website (https://prism.oregonstate.edu/normals/) and has a spatial resolution of 30 arcsec (800 m). The three... -
Federal
Wind Turbine Sound Setbacks: Ordinances (2024) and Extrapolated Trends, 115 Hub Height, 170 Rotor Diameter
Department of Energy —
This dataset provides a comprehensive assessment of wind turbine sound setbacks for all residential structures across the contiguous United States (CONUS). A sound... -
Federal
GPM IMERG Final Precipitation L3 1 day 0.1 degree x 0.1 degree V07 (GPM_3IMERGDF) at GES DISC
National Aeronautics and Space Administration —
Version 07 is the current version of the data set. Older versions will no longer be available and have been superseded by Version 07.The Integrated Multi-satellitE... -
Federal
AIS Vessel Transit Counts 2024
National Oceanic and Atmospheric Administration, Department of Commerce —
Automatic Identification Systems (AIS) are a navigation safety device that transmits and monitors the location and characteristics of many vessels in U.S. and... -
Federal
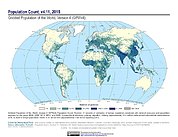
Gridded Population of the World, Version 4 (GPWv4): Population Count, Revision 11
National Aeronautics and Space Administration —
The Gridded Population of the World, Version 4 (GPWv4): Population Count, Revision 11 consists of estimates of human population (number of persons per pixel),... -
Federal
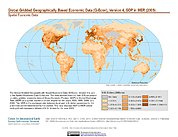
Global Gridded Geographically Based Economic Data (G-Econ), Version 4
National Aeronautics and Space Administration —
The Global Gridded Geographically Based Economic Data (G-Econ), Version 4 contains derived one degree grid cells of Gross Domestic Product (GDP) data in Grid and... -
Federal
NACP Regional: National Greenhouse Gas Inventories and Aggregated Gridded Model Data
National Aeronautics and Space Administration —
This data set provides two products that were derived from the recently published North American Carbon Program (NACP) Regional Synthesis 1-degree terrestrial... -
Federal
Global Flood Hazard Frequency and Distribution
National Aeronautics and Space Administration —
The Global Flood Hazard Frequency and Distribution is a 2.5 minute grid derived from a global listing of extreme flood events between 1985 and 2003 (poor or missing... -
Federal
U.S. Wind and Solar PV Supply Curves with Future Land-use Change
Department of Energy —
This dataset provides future supply curves representing the total resource potential for land-based wind and solar photovoltaic (PV) deployment in the conterminous... -
Federal
Global CFDDA-based Onshore and Offshore Wind Potential Supply Curves by Country, Class, and Depth
Department of Energy —
This dataset contains global onshore and offshore wind supply curves based on a resource assessment performed at the National Renewable Energy Laboratory (NREL) based... -
Federal
GPM Ground Validation Daily Precipitation OLYMPEX
National Aeronautics and Space Administration —
The GPM Ground Validation Daily Precipitation Olympic Mountain Experiment (OLYMPEX) dataset consists of a single netCDF-4 data file containing estimates of daily... -
Federal
Pre- and post-White-nose Syndrome Bat Capture Models
Department of the Interior —
These data are the collection of generalized linear mixed models run for AIC comparison of the pre- and post-White-nose Syndrome bat mist-net captures and percent... -
Federal
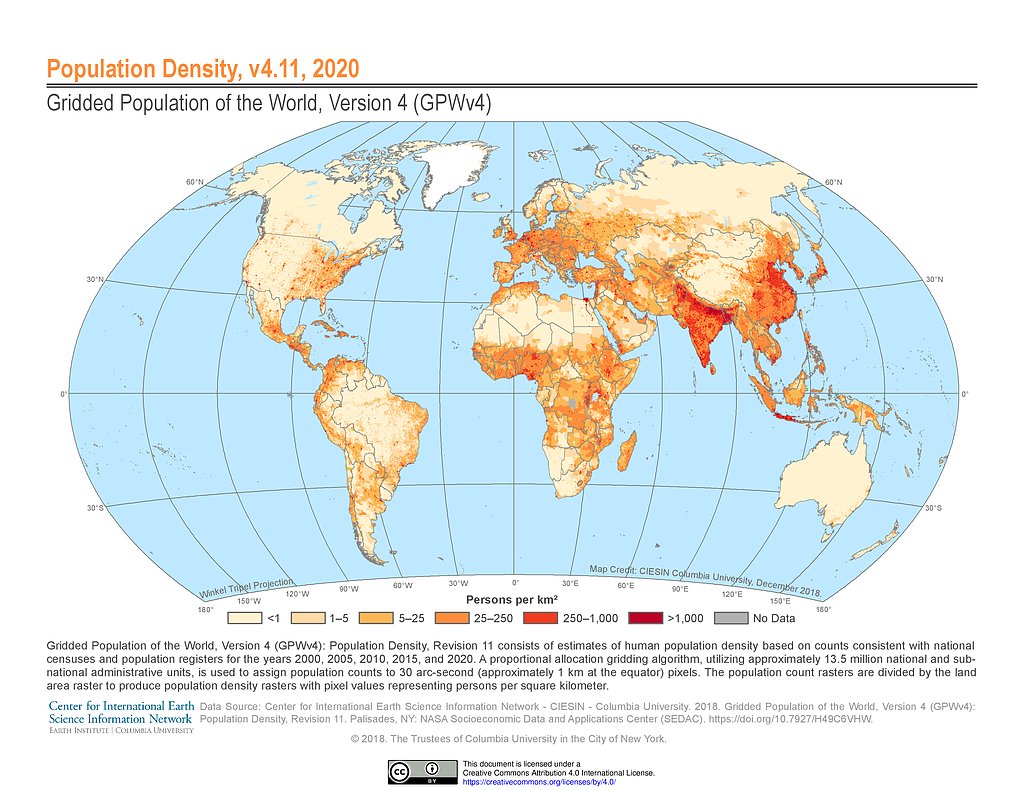
Gridded Population of the World, Version 4 (GPWv4): Population Density, Revision 11
National Aeronautics and Space Administration —
The Gridded Population of the World, Version 4 (GPWv4): Population Density, Revision 11 consists of estimates of human population density (number of persons per... -
Federal
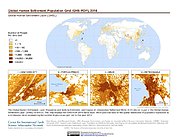
Global Human Settlement Layer: Population and Built-Up Estimates, and Degree of Urbanization Settlement Model Grid
National Aeronautics and Space Administration —
The Global Human Settlement Layer: Population and Built-Up Estimates, and Degree of Urbanization Settlement Model Grid data set provides gridded data on human... -
Federal
Hydrologic Soil Group for the Upper Colorado River Basin in Daymet Climate Data resolution (hsg_UCRB_Daymet_resolution.txt)
Department of the Interior —
hsg_UCRB_Daymet_resolution.txt is an Esri ASCII grid representing the hydrologic soil group (HSG) for the Upper Colorado River Basin. The HSG for an area is... -
Federal
Northern Hemisphere EASE-Grid 2.0 Weekly Snow Cover and Sea Ice Extent, Version 4
National Aeronautics and Space Administration —
The main parameters for this data set are snow cover and sea ice extent; both parameters are derived from SMMR and DMSP-F8, -F11, -F13, and -F17 SSM/I and SSMIS... -
Federal
Stanford Thermal Earth Model for the Conterminous United States
Department of Energy —
Provided here are various forms of the Stanford Thermal Earth Model, as well as the data and methods used for its creation. The predictions produced by this model...
973 datasets found for ""Grid Cells""