
-
Federal
High Tide Flooding Products from NOAA CO-OPS
National Oceanic and Atmospheric Administration, Department of Commerce —
High tide flooding is the overflow or excess accumulation of water that covers typically dry coastal land and occurs during high tides. As relative sea levels rise,... -
Federal
I01 Optics
National Oceanic and Atmospheric Administration, Department of Commerce —
Ocean observation data from the Northeastern Regional Association of Coastal & Ocean Observing Systems (NERACOOS). The NERACOOS region includes the northeast... -
Federal
Federal and State Waters
National Oceanic and Atmospheric Administration, Department of Commerce —
These data show the geographic representation of Federal and State Waters for the purpose of display in the MarineCadastre.gov OceanReports application. The boundary... -
Federal
GLS Offices
Department of Transportation —
The Great Lakes St Lawrence Seaway Development Corporation (GLS) Offices dataset was compiled January 25, 2023 from the Great Lakes St. Lawrence Seaway Development... -
Federal
Containerized Exports' Value and Weight by Port in 2023
Department of Transportation —
Source: U.S. Department of Transportation, Bureau of Transportation Statistics, based upon U.S. Department of Commerce, U.S. Census Bureau, Foreign Trade Division,... -
Federal
Navigation Facilities NGDA
Department of Transportation —
The Navigation Facilities dataset is periodically updated by the United States Army Corp of Engineers (USACE) and is part of the U.S. Department of Transportation... -
Federal
Port Areas
Department of Transportation —
The Port Areas dataset was updated on July 21, 2025 from the United States Army Corp of Engineers (USACE) and is part of the U.S. Department of Transportation... -
Federal
WOCE Global Data: Current Meter Data, Version 3.0: ocean circulation and other data from ADCP current meters, CTD casts, tidal gauges, and other instruments world-wide from 1985 to 2000 (NCEI Accession 0000649)
National Oceanic and Atmospheric Administration, Department of Commerce —
Compilation of ocean circulation and other data were collected from a World-Wide distribution by Oregon State University (OSU) and other institutions as part of World... -
Federal
WATER TEMPERATURE and other data from MARIA PAOLINA G. from 1954-09-10 to 1967-09-27 (NCEI Accession 7600064)
National Oceanic and Atmospheric Administration, Department of Commerce —
Data has been processed by NODC to the NODC standard Bathythermograph (MBT) (C128) format. The C128 format is used for temperature-depth profile data obtained using... -
Federal
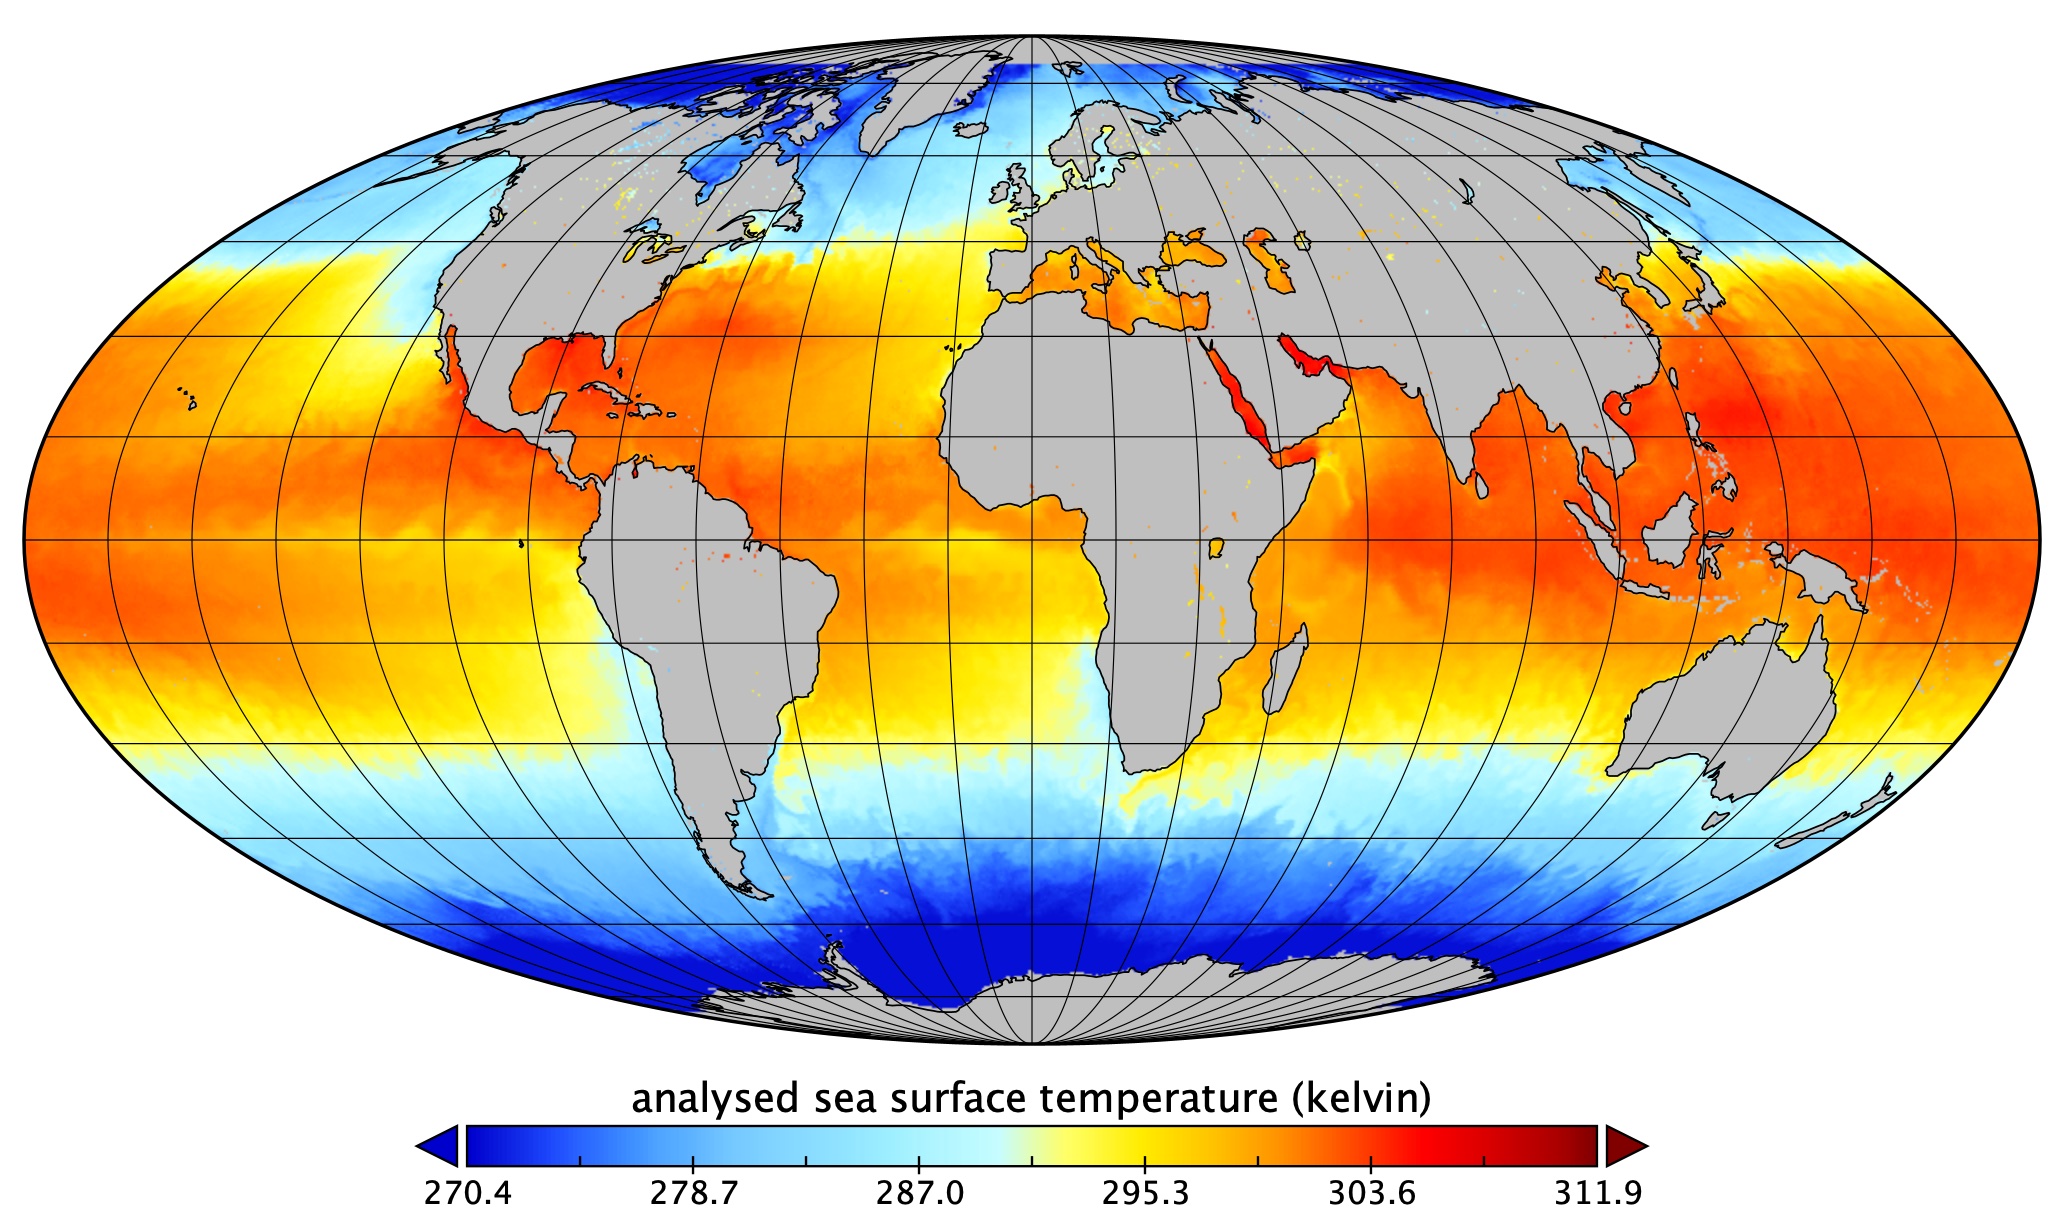
GHRSST Level 4 SPoRT Global Foundation Sea Surface Temperature Analysis (v1.0)
National Aeronautics and Space Administration —
The GHRSST Level 4 SPoRT Global Foundation Sea Surface Temperature Analysis (v1.0) dataset is produced by the by the NASA Short-term Prediction Research and... -
Federal
Freight Activity
Department of Transportation —
Weekly measures of freight activity during the COVID-19 pandemic -
Federal
NERACOOS Gulf of Maine Ocean Array: Realtime Buoy Observations: C02 Casco Bay: C02 ACCELEROMETER Casco Bay
National Oceanic and Atmospheric Administration, Department of Commerce —
Ocean observation data from the Northeastern Regional Association of Coastal & Ocean Observing Systems (NERACOOS). The NERACOOS region includes the northeast... -
Federal
US-Total Electron Content Product (USTEC)
National Oceanic and Atmospheric Administration, Department of Commerce —
The US Total Electron Content (US-TEC) product is designed to specify TEC over the Continental US (CONUS) in near real-time. The product uses a Kalman Filter data... -
Federal
E01 Met - Meteorology
National Oceanic and Atmospheric Administration, Department of Commerce —
Ocean observation data from the Northeastern Regional Association of Coastal & Ocean Observing Systems (NERACOOS). The NERACOOS region includes the northeast... -
Federal
Ferry Routes
Department of Transportation —
The National Census of Ferry Operators (NCFO) Routes dataset was collected through December 31, 2022 and compiled on October 27, 2025 from the Bureau of... -
State
Loaded Containers Monthly Imports and Exports Through Port Authority of NY NJ Maritime Terminals: Beginning 2000
State of New York —
This dataset describes the total volume of Import and Export Loaded Containers moved through maritime terminals located within Port Authority property in the Port of... -
Federal
Global Navigation Satellite System (GNSS) IGS Decoded Clock Solution (10-second) from IGS Real-Time Product Streams from NASA CDDIS
National Aeronautics and Space Administration —
This derived product set consists of Global Navigation Satellite System satellite and receiver clock products (10-second granularity, daily files, generated daily)... -
Federal
NOAA Tidal Currents for Coastal, Estuaries and Great Lakes (non-tidal) regions
National Oceanic and Atmospheric Administration, Department of Commerce —
Since the late-1800s, NOAAâs Center for Operational Oceanographic Products and Services (CO-OPS) and its predecessors have been collecting, analyzing and... -
Federal
High Angular Momentum Coupling for Enhanced Sensing in the VHF Band
National Institute of Standards and Technology —
Recent advances in Rydberg atom electrometry detail promising applications in radiofrequency (RF) communications. Presently, most applications use carrier frequencies...- The first column of the data is the spectrum analyzer frequency. The rest of the columns give the signal power for each frequency for different received field strengths.
- There are 4 groups of data that give field strength in one column and SNR in another. The different groups are for the two different atoms (RB and CS) and the two different methods for each (Stark and HAMMER).
- There are 4 groups of data that give field strength in one column and packet success rate in another. The different groups are for the two different atoms (RB and CS) and the two different methods for each (Stark and HAMMER).
- The data is given in 3 columns. Column 1 gives the spectrum analyzer frequency, column 2 gives the signal spectrum without a split ring present, and column 3 gives the spectrum with the split ring resonator present.
- The first column of the data gives the field strength applied (V/cm). The rest of the columns give the stark shift in MHz for the different Rydberg states as labeled.
- There are two sets of data, one for Rb and one for Cs. The first column is radio gain and the second column is the measured field.
- 1 more in dataset

Official websites use .gov
A
.gov website belongs to an official government
organization in the United States.
Secure .gov websites use HTTPS
A
lock (
) or https:// means you’ve safely connected to
the .gov website. Share sensitive information only on official,
secure websites.