
-
Federal
Flood Video Files for Bridge Camera (Station 1), Chalk Cliffs, Colorado, USA, 2015
Department of the Interior —
Chalk Cliffs, located 8 miles southwest of Buena Vista, Colorado, is one of the most active debris-flow areas in the state (U.S. Geological Survey). This "Child item"... -
Federal
May 1983 Akita, Honshu, Japan Images
National Oceanic and Atmospheric Administration, Department of Commerce —
The tsunami generated by a magnitude 7.9 (Mw) earthquake destroyed 700 boats and 59 houses for a total of $800 million in property damage in Japan (1983 dollars). One... -
Federal
July 1976 Tangshan, China Images
National Oceanic and Atmospheric Administration, Department of Commerce —
Northeastern China. Damage: $5,600 million. The death toll (240,000) was one of largest in recorded history from an earthquake. In addition, around 800,000 were... -
Federal
March 1964 Prince William Sound, USA Images
National Oceanic and Atmospheric Administration, Department of Commerce —
The Prince William Sound magnitude 9.2 Mw earthquake on March 28, 1964 at 03:36 GMT (March 27 at 5:36 pm local time), was the largest U.S. earthquake ever recorded... -
Federal
West Florida, 1993-1995 Environmental Sensitivity Index Map
National Oceanic and Atmospheric Administration, Department of Commerce —
Environmental Sensitivity Index (ESI) maps are an integral component in oil-spill contingency planning and assessment. They serve as a source of information in the... -
Federal
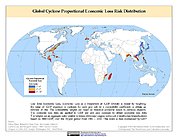
Global Cyclone Proportional Economic Loss Risk Deciles
National Aeronautics and Space Administration —
The Global Cyclone Proportional Economic Loss Risk Deciles is a 2.5 minute grid of cyclone hazard economic loss as proportions of Gross Domestic Product (GDP) per... -
Federal
NEOWAVE Regional Tsunami Model: Hawaii: Oahu: Pearl Harbor
National Oceanic and Atmospheric Administration, Department of Commerce —
Non-hydrostatic Evolution of Ocean WAVEs (NEOWAVE) regional tsunami model for Pearl Harbor on the south coast of the island of Oahu in the state of Hawaii,... -
Federal
California State Waters Map Series--Offshore of Salt Point Web Services
Department of the Interior —
In 2007, the California Ocean Protection Council initiated the California Seafloor Mapping Program (CSMP), designed to create a comprehensive seafloor map of high-... -
Federal
Continental United States Hurricane Strikes Since 1950
National Oceanic and Atmospheric Administration, Department of Commerce —
This is an annual edition poster showing all of the hurricanes having impacted the continental U.S. from 1950 to 2022. This 36x28 inch glossy poster gives a quick... -
Federal
Hurricane Storm Surge Inundation: Honolulu, Hawaii
National Oceanic and Atmospheric Administration, Department of Commerce —
Computer model simulation of hurricane storm surge inundation around Honolulu, Hawaii using current sea level at mean higher high water (MHHW) as its baseline water... -
Federal
Debris-flow Video Files for Bridge Cameras (Upper Station), Chalk Cliffs, Colorado, USA, 2019
Department of the Interior —
Chalk Cliffs, located 8 miles southwest of Buena Vista, CO, is one of the most active debris-flow areas in the state (U.S. Geological Survey). This "Child item" page... -
Federal
May 1983 Coalinga, USA Images
National Oceanic and Atmospheric Administration, Department of Commerce —
Location: Central California, 20.8 kilometers from Coalinga. Affected area: 205,000 square kilometers. Damage: $31 million. The most serious damage occurred in the... -
Federal
NEOWAVE Regional Tsunami Model: Hawaii: Kauai: Nawiliwili
National Oceanic and Atmospheric Administration, Department of Commerce —
Non-hydrostatic Evolution of Ocean WAVEs (NEOWAVE) regional tsunami model for Nawiliwili Harbor on the southeast coast of the island of Kauai in the state of Hawaii,... -
Federal
Archival and Discovery of April 1, 1946 Tsunami Event on Marigrams
National Oceanic and Atmospheric Administration, Department of Commerce —
NOAA National Centers for Environmental Information have more than 3,000 tsunami marigram (tide gauge) records in both image and paper format. The majority of these... -
Federal
Hurricane Sandy Poster (October 29, 2012)
National Oceanic and Atmospheric Administration, Department of Commerce —
Hurricane Sandy poster. Multi-spectral image from Suomi-NPP shows Hurricane Sandy approaching the New Jersey Coast on October 29, 2012. Poster size is approximately... -
Federal
Sea Level Rise: American Samoa: Extreme High-Tide Flooding: 2060 Intermediate-Low Scenario: 50 Days Per Year
National Oceanic and Atmospheric Administration, Department of Commerce —
This extreme high-tide flooding layer provides a prediction of future sea level rise (SLR) inundation and was produced using a passive flooding model, often referred... -
Federal
Sea Level Rise: American Samoa: Extreme High-Tide Flooding: 2-Ft Scenario: 50 Days Per Year
National Oceanic and Atmospheric Administration, Department of Commerce —
This extreme high-tide flooding layer provides a prediction of future sea level rise (SLR) inundation and was produced using a passive flooding model, often referred... -
Federal
ESI-HI14 Puu Hou, Island of Hawaii, Hawaii 2001 (Environmental Sensitivity Index Map)
National Oceanic and Atmospheric Administration, Department of Commerce —
Environmental Sensitivity Index (ESI) maps are an integral component in oil-spill contingency planning and assessment. They serve as a source of information in the... -
Federal
Sea Level Rise: American Samoa: Extreme High-Tide Flooding: 2060 Intermediate Scenario: 20 Days Per Year
National Oceanic and Atmospheric Administration, Department of Commerce —
This extreme high-tide flooding layer provides a prediction of future sea level rise (SLR) inundation and was produced using a passive flooding model, often referred...

Official websites use .gov
A
.gov website belongs to an official government
organization in the United States.
Secure .gov websites use HTTPS
A
lock (
) or https:// means you’ve safely connected to
the .gov website. Share sensitive information only on official,
secure websites.