Trends of Thermal, Wetness, and Vegetative Change in the Circumpolar Arctic
Access & Use Information
Downloads & Resources
-
Google Scholar search resultsHTML
Search results for publications that cite this dataset by its DOI.
-
Download this datasetHTML
This link allows direct data access via Earthdata login
-
View documentation related to this datasetHTML
ORNL DAAC Data Set Documentation
-
This dataset's landing pageHTML
Data set Landing Page DOI URL
-
View documentation related to this datasetHTML
Trends of Thermal, Wetness, and Vegetative Change in the Circumpolar Arctic:...
-
View documentation related to this datasetHTML
Trends of Thermal, Wetness, and Vegetative Change in the Circumpolar Arctic:...
-
View documentation related to this datasetHTML
Trends of Thermal, Wetness, and Vegetative Change in the Circumpolar Arctic:...
-
View documentation related to this datasetHTML
Trends of Thermal, Wetness, and Vegetative Change in the Circumpolar Arctic:...
-
View documentation related to this datasetHTML
Trends of Thermal, Wetness, and Vegetative Change in the Circumpolar Arctic:...
-
View documentation related to this datasetHTML
Trends of Thermal, Wetness, and Vegetative Change in the Circumpolar Arctic:...
-
View documentation related to this datasetHTML
Trends of Thermal, Wetness, and Vegetative Change in the Circumpolar Arctic:...
-
View documentation related to this datasetHTML
Trends of Thermal, Wetness, and Vegetative Change in the Circumpolar Arctic:...
-
View documentation related to this datasetHTML
Trends of Thermal, Wetness, and Vegetative Change in the Circumpolar Arctic:...
-
View documentation related to this datasetHTML
Trends of Thermal, Wetness, and Vegetative Change in the Circumpolar Arctic:...
-
View documentation related to this datasetHTML
Trends of Thermal, Wetness, and Vegetative Change in the Circumpolar Arctic:...
-
View documentation related to this datasetHTML
Trends of Thermal, Wetness, and Vegetative Change in the Circumpolar Arctic:...
-
View documentation related to this datasetPDF
Trends of Thermal, Wetness, and Vegetative Change in the Circumpolar Arctic:...
-
View documentation related to this datasetPDF
Trends of Thermal, Wetness, and Vegetative Change in the Circumpolar Arctic:...
-
View documentation related to this datasetHTML
Trends of Thermal, Wetness, and Vegetative Change in the Circumpolar Arctic:...
-
Get a related visualizationJPEG
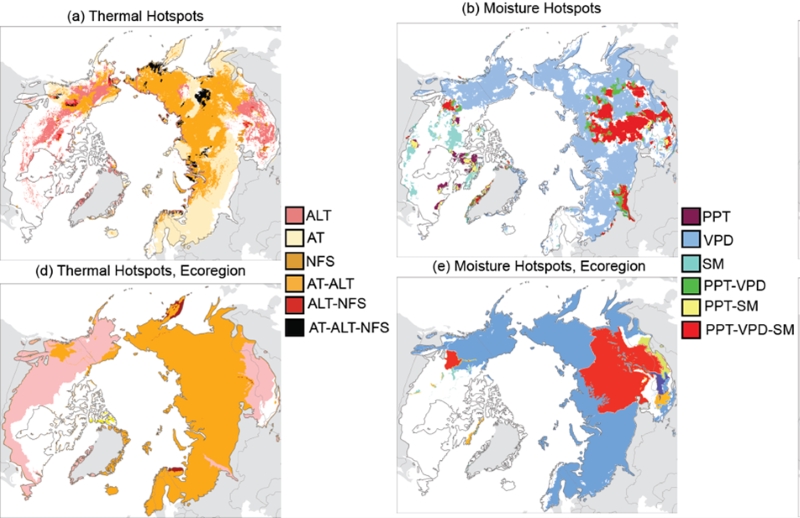
Multivariate change hotspot maps for the 1997 to 2020 period, according to...
-
The dataset's project home pageHTML
ABoVE project site
-
Landing PageLanding Page
Dates
| Metadata Created Date | March 28, 2024 |
|---|---|
| Metadata Updated Date | March 28, 2024 |
Metadata Source
- Data.json Data.json Metadata
Harvested from NASA Data.json
Graphic Preview

Additional Metadata
| Resource Type | Dataset |
|---|---|
| Metadata Created Date | March 28, 2024 |
| Metadata Updated Date | March 28, 2024 |
| Publisher | ORNL_DAAC |
| Maintainer | |
| Identifier | C2883645605-ORNL_CLOUD |
| Data First Published | 2024-02-29 |
| Language | en-US |
| Data Last Modified | 2024-03-02 |
| Category | ABoVE, geospatial |
| Public Access Level | public |
| Bureau Code | 026:00 |
| Metadata Context | https://project-open-data.cio.gov/v1.1/schema/catalog.jsonld |
| Metadata Catalog ID | https://data.nasa.gov/data.json |
| Schema Version | https://project-open-data.cio.gov/v1.1/schema |
| Catalog Describedby | https://project-open-data.cio.gov/v1.1/schema/catalog.json |
| Citation | Watts, J.D., S. Potter, B.M. Rogers, A-M. Virkkala, G. Fiske, K. Arndt, A. Burrell, S. Natali, K. Butler, B. Gerlt, J. Grayson, T.A. Shestakova, J. Du, and Y. Kim. 2023. Trends of Thermal, Wetness, and Vegetative Change in the Circumpolar Arctic. ORNL DAAC, Oak Ridge, Tennessee, USA. https://doi.org/10.3334/ORNLDAAC/2322 |
| Graphic Preview Description | Multivariate change hotspot maps for the 1997 to 2020 period, according to select directional changes in thermal, moisture, and vegetation indicators. Thermal indicator includes: average increase in annual air temperature (AT, degrees C); increase in annual non-frozen season (NFS, days); and increase in annual active layer thickness (ALT, m). Moisture indicator includes: decrease in annual precipitation (PPT, mm); increase in annual vapor pressure deficit (VPD, kPa); and a decrease in annual non-frozen season soil moisture (SM, cm3 cm-3). Panels (a) and (b) show identified change based on pixel-level analyses; (d) and (e) show indicator change across individual ecoregions. |
| Graphic Preview File | https://daac.ornl.gov/ABOVE/guides/CircumArctic_Trends_Hotspots_Fig1.jpg |
| Harvest Object Id | 7ab46a8d-ef06-43a7-80d1-5f58710185af |
| Harvest Source Id | 58f92550-7a01-4f00-b1b2-8dc953bd598f |
| Harvest Source Title | NASA Data.json |
| Homepage URL | https://doi.org/10.3334/ORNLDAAC/2322 |
| Metadata Type | geospatial |
| Old Spatial | -180.0 30.0 180.0 90.0 |
| Program Code | 026:001 |
| Source Datajson Identifier | True |
| Source Hash | d9e3d21db5a1ae840c4530eea702d7199088e8eaecb6d29f5e74367ec72af70d |
| Source Schema Version | 1.1 |
| Spatial | |
| Temporal | 1980-01-01T00:00:01Z/2020-12-31T23:59:59Z |
Didn't find what you're looking for? Suggest a dataset here.

