Topographic and Soil Carbon Reconstructions in Agricultural Fields, Iowa
Access & Use Information
Downloads & Resources
-
Google Scholar search resultsHTML
Search results for publications that cite this dataset by its DOI.
-
Download this datasetHTML
This link allows direct data access via Earthdata login
-
View documentation related to this datasetHTML
ORNL DAAC Data Set Documentation
-
This dataset's landing pageHTML
Data set Landing Page DOI URL
-
View documentation related to this datasetPDF
Topographic and Soil Carbon Reconstructions in Agricultural Fields, Iowa:...
-
Get a related visualizationPNG
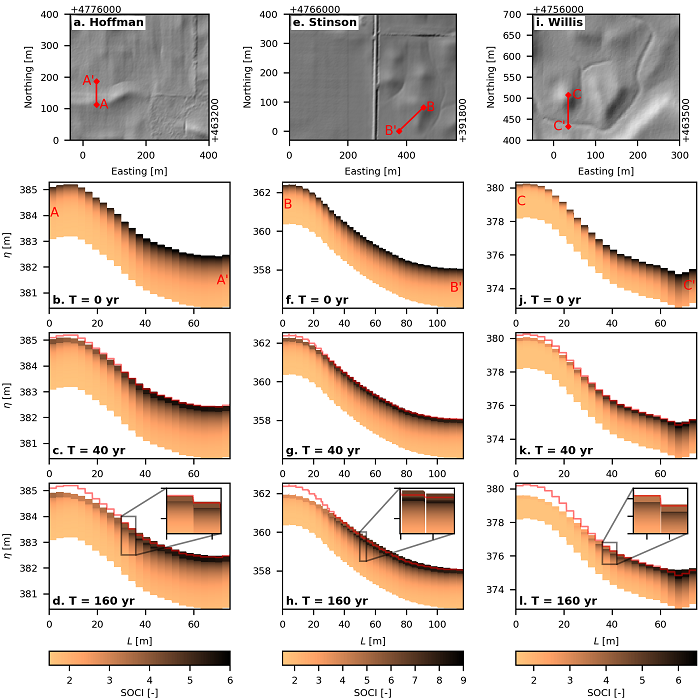
Hillslope transects at three sites showing redistribution of soil organic...
-
Landing PageLanding Page
Dates
| Metadata Created Date | May 30, 2023 |
|---|---|
| Metadata Updated Date | December 7, 2023 |
Metadata Source
- Data.json Data.json Metadata
Harvested from NASA Data.json
Other Data Resources
- Geoplatform Metadata Information
Graphic Preview

Additional Metadata
| Resource Type | Dataset |
|---|---|
| Metadata Created Date | May 30, 2023 |
| Metadata Updated Date | December 7, 2023 |
| Publisher | ORNL_DAAC |
| Maintainer | |
| Identifier | C2575422019-ORNL_CLOUD |
| Data First Published | 2022-12-29 |
| Language | en-US |
| Data Last Modified | 2023-06-12 |
| Category | NACP, geospatial |
| Public Access Level | public |
| Bureau Code | 026:00 |
| Metadata Context | https://project-open-data.cio.gov/v1.1/schema/catalog.jsonld |
| Metadata Catalog ID | https://data.nasa.gov/data.json |
| Schema Version | https://project-open-data.cio.gov/v1.1/schema |
| Catalog Describedby | https://project-open-data.cio.gov/v1.1/schema/catalog.json |
| Citation | Kwang, J.S., E.A. Thaler, and I.J. Larsen. 2022. Topographic and Soil Carbon Reconstructions in Agricultural Fields, Iowa. ORNL DAAC, Oak Ridge, Tennessee, USA. https://doi.org/10.3334/ORNLDAAC/1944 |
| Graphic Preview Description | Hillslope transects at three sites showing redistribution of soil organic carbon (SOC) simulated over 160 years in Iowa. Sites (columns): Hoffman, Stinson, and Willis. Upper row shows hillshade maps illustrating topography at each site. Red lines show location of transects proceeding from upslope to downslope (e.g., A to A). Lower three rows illustrate pattern of SOC along the transect distance (L) at soil depths at beginning of simulation (0 y), after 40 y, and at end of simulation (160 y). Red lines indicate the initial surface elevation at beginning of simulation. Insets highlight cases where soil with low SOC blankets soil with higher SOC. |
| Graphic Preview File | https://daac.ornl.gov/NACP/guides/TillageErosion_SOCRedistribute_Fig1.png |
| Harvest Object Id | eb6cfa5d-b957-4d66-afd2-f66ba2189a5a |
| Harvest Source Id | 58f92550-7a01-4f00-b1b2-8dc953bd598f |
| Harvest Source Title | NASA Data.json |
| Homepage URL | https://doi.org/10.3334/ORNLDAAC/1944 |
| Metadata Type | geospatial |
| Old Spatial | -94.33 43.04 -94.32 43.05 |
| Program Code | 026:001 |
| Source Datajson Identifier | True |
| Source Hash | b3c002f351a5b77e89cf888041ba30b8927598adef48ccb4db03941bc436c50c |
| Source Schema Version | 1.1 |
| Spatial | |
| Temporal | 1859-08-01T00:00:00Z/2019-08-01T23:59:59Z |
Didn't find what you're looking for? Suggest a dataset here.


