SSMI(S) Hydrological Products
Access & Use Information
Downloads & Resources
-
NCEI Dataset Landing Page
Landing page for the dataset.
-
NCEI Direct Download
Direct Download links for dataset files.
-
NOAA National Centers for Environmental...
NCEI home page with information, data access and contact information.
-
Global Change Master Directory (GCMD) Keywords
The information provided on this page seeks to define how the GCMD Keywords...
-
GCOS Essential Climate Variables
Overview of the GCOS Essential Climate Variables.
-
Global Change Master Directory (GCMD) Keywords
The information provided on this page seeks to define how the GCMD Keywords...
-
Global Change Master Directory (GCMD) Keywords
The information provided on this page seeks to define how the GCMD Keywords...
-
Global Change Master Directory (GCMD) Keywords
The information provided on this page seeks to define how the GCMD Keywords...
-
Global Change Master Directory (GCMD) Keywords
The information provided on this page seeks to define how the GCMD Keywords...
-
Global Change Master Directory (GCMD) Keywords
The information provided on this page seeks to define how the GCMD Keywords...
-
Global Change Master Directory (GCMD) Keywords
The information provided on this page seeks to define how the GCMD Keywords...
-
Global Change Master Directory (GCMD) Keywords
The information provided on this page seeks to define how the GCMD Keywords...
-
An Eight-Year (1987-1994) Time Series of...
Published paper associated with dataset. DOI:...
-
Improved Global Rainfall Retrieval Using the...
Published paper associated with dataset. DOI:...
-
The Performance of Hydrological Monthly...
Published paper associated with dataset. DOI:...
-
GPCP Monthly V2.3
Related dataset.
Dates
| Metadata Date | June 23, 2023 |
|---|---|
| Metadata Created Date | October 28, 2022 |
| Metadata Updated Date | September 19, 2023 |
| Reference Date(s) | September 1, 2012 (publication), November 1, 2017 (revision) |
| Frequency Of Update | monthly |
Metadata Source
- ISO-19139 ISO-19139 Metadata
Harvested from ncdc
Other Data Resources
- Geoplatform Metadata Information
Graphic Preview

Additional Metadata
| Resource Type | Dataset |
|---|---|
| Metadata Date | June 23, 2023 |
| Metadata Created Date | October 28, 2022 |
| Metadata Updated Date | September 19, 2023 |
| Reference Date(s) | September 1, 2012 (publication), November 1, 2017 (revision) |
| Responsible Party | NOAA National Centers for Environmental Information (Point of Contact) |
| Contact Email | |
| Guid | gov.noaa.ncdc:C00789 |
| Access Constraints | Cite as: Semunegus, Hilawe; Ferraro, Ralph: (2012) SSMI(S) Hydrological Products [indicate subset used]. NOAA National Climatic Data Center. doi:10.7289/V5QF8R3K[indicate access date], Please also cite the following science paper when using this dataset: Vila, D., C. Hernandez, R. Ferraro, and H. Semunegus, 2013: The Performance of Hydrological Monthly Products Using SSM/I-SSMI/S Sensors. J. Hydrometeor., 14, 266-274, https://doi.org/10.1175/JHM-D-12-056.1, Please also cite the following science paper when using this dataset: Ferraro, R.R., N.C. Grody, F. Weng, and A. Basist, 1996: An Eight-Year (1987-1994) Time Series of Rainfall, Clouds, Water Vapor, Snow Cover, and Sea Ice Derived from SSM/I Measurements. Bull. Amer. Meteor. Soc., 77, 891-905, https://doi.org/10.1175/1520-0477(1996)077<0891:AEYTSO>2.0.CO;2, Distribution liability: NOAA and NCEI make no warranty, expressed or implied, regarding these data, nor does the fact of distribution constitute such a warranty. NOAA and NCEI cannot assume liability for any damages caused by any errors or omissions in these data. If appropriate, NCEI can only certify that the data it distributes are an authentic copy of the records that were accepted for inclusion in the NCEI archives., Use liability: NOAA and NCEI cannot provide any warranty as to the accuracy, reliability, or completeness of furnished data. Users assume responsibility to determine the usability of these data. The user is responsible for the results of any application of this data for other than its intended purpose. |
| Bbox East Long | 180.0 |
| Bbox North Lat | 90.0 |
| Bbox South Lat | -90.0 |
| Bbox West Long | -180.0 |
| Coupled Resource | |
| Frequency Of Update | monthly |
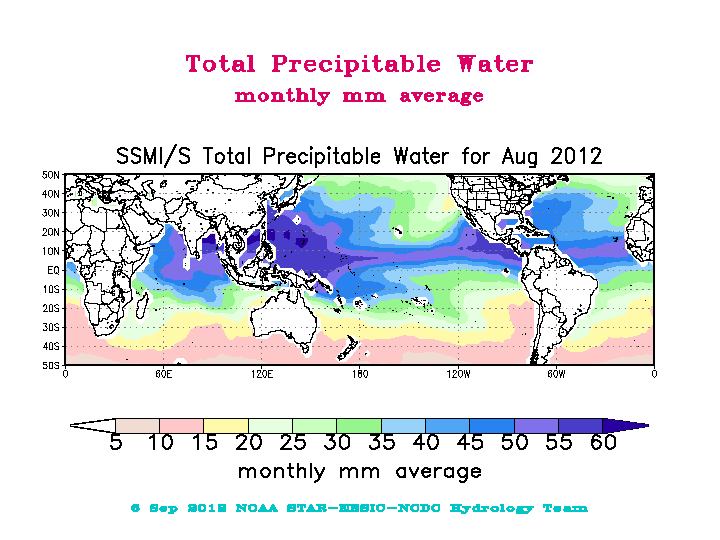
| Graphic Preview Description | SSMI-SSMIS Hydrological Products image example |
| Graphic Preview File | https://www.ncei.noaa.gov/pub/data/metadata/images/C00789_mw-hydro-2-5-grid.gif |
| Graphic Preview Type | GIF |
| Harvest Object Id | e7a1580f-4d15-455c-b55b-9a0d997c35d7 |
| Harvest Source Id | 2cb3ef77-1683-4c2a-9119-dc65e50917c6 |
| Harvest Source Title | ncdc |
| Licence | In October 2017, 2.5 degree and gpcp-input data files were identified as having the incorrect data date encoded in the netCDF. These files have been replaced in the archive. Users are encouraged to use data files with a create date later than October 18, 2017 to ensure they are using the best quality file. |
| Lineage | For more information about the production of this dataset, users should review the published science papers associated with the dataset. |
| Metadata Language | eng; USA |
| Metadata Type | geospatial |
| Old Spatial | {"type": "Polygon", "coordinates": [[[-180.0, -90.0], [180.0, -90.0], [180.0, 90.0], [-180.0, 90.0], [-180.0, -90.0]]]} |
| Progress | onGoing |
| Spatial Data Service Type | |
| Spatial Reference System | |
| Spatial Harvester | True |
| Temporal Extent Begin | 1987-07-01 |
Didn't find what you're looking for? Suggest a dataset here.


