Solar Features - Solar Flares
Access & Use Information
Downloads & Resources
-
Space Flares
Various datasets on hydrogen-alpha flares, x-ray flares and related information.
-
Global Change Master Directory (GCMD) Keywords
21 views
The information provided on this page seeks to define how the GCMD Keywords...
-
Global Change Master Directory (GCMD) Keywords
21 views
The information provided on this page seeks to define how the GCMD Keywords...
Dates
| Metadata Date | October 2, 2015 |
|---|---|
| Metadata Created Date | November 12, 2020 |
| Metadata Updated Date | November 12, 2020 |
| Reference Date(s) | August 10, 2014 (publication) |
| Frequency Of Update | annually |
Metadata Source
- ISO-19139 ISO-19139 Metadata
Harvested from NGDC STP Solar
Graphic Preview

Additional Metadata
| Resource Type | Nongeographicdataset |
|---|---|
| Metadata Date | October 2, 2015 |
| Metadata Created Date | November 12, 2020 |
| Metadata Updated Date | November 12, 2020 |
| Reference Date(s) | August 10, 2014 (publication) |
| Responsible Party | DOC/NOAA/NESDIS/NCEI > National Centers for Environmental Information, NESDIS, NOAA, U.S. Department of Commerce (Point of Contact) |
| Contact Email | |
| Guid | gov.noaa.ngdc.stp.solar:solar-features_solar-flares |
| Access Constraints | Access Constraints: None Use Constraints: None Distribution Liability: While every effort has been made to ensure that these data are accurate and reliable within the limits of the current state of the art, NOAA cannot assume liability for any damages caused by any errors or omissions in the data, nor as a result of the failure of the data to function on a particular system. NOAA makes no warranty, expressed or implied, nor does the fact of distribution constitute such a warranty. |
| Bbox East Long | 180 |
| Bbox North Lat | 90 |
| Bbox South Lat | -90 |
| Bbox West Long | -180 |
| Coupled Resource | |
| Frequency Of Update | annually |
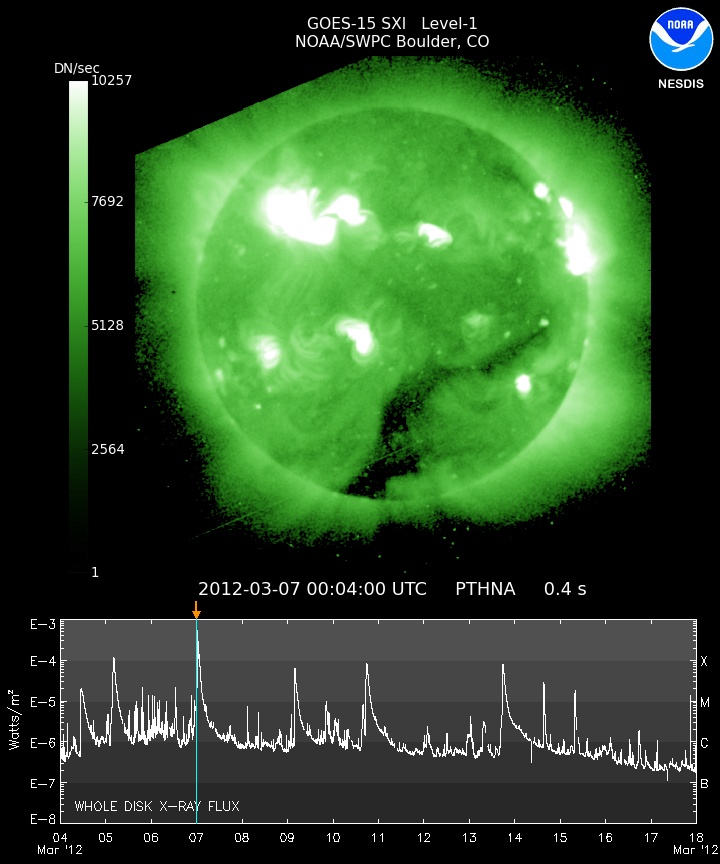
| Graphic Preview Description | Browse image of sun from the NOAA Solar X-ray Imager (SXI) for 07-March-2012 with the X-ray Sensor (XRS) superimposed below the image. |
| Graphic Preview File | https://www.ngdc.noaa.gov/stp/space-weather/solar-data/solar-features/solar-flares/documentation/miscellaneous/browse-graphic_sxi_20120307.jpg |
| Graphic Preview Type | Joint Photographic Experts Group (jpg) format |
| Harvest Object Id | f7ba706d-ae9e-49c6-ad92-28ed347ff749 |
| Harvest Source Id | 71a80367-917c-4f7c-a316-e2fff4d16c62 |
| Harvest Source Title | NGDC STP Solar |
| Licence | |
| Metadata Language | eng; U.S.A. |
| Metadata Type | geospatial |
| Progress | underDevelopment |
| Spatial Data Service Type | |
| Spatial Reference System | |
| Spatial Harvester | True |
| Temporal Extent Begin | 1938-01-01 |
| Temporal Extent End | Present |
Didn't find what you're looking for? Suggest a dataset here.

