

Simulating Degradation Data for Prognostic Algorithm Development
Access & Use Information
Public: This dataset is intended for public access and use.
License: No license information was provided. If this work was prepared by an officer or employee of the United States government as part of that person's official duties it is considered a U.S. Government Work.
Downloads & Resources
-
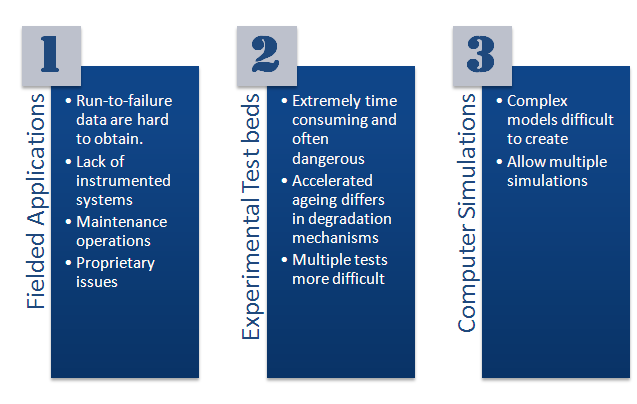
3_modes.bmpBMP
Figure 1
-
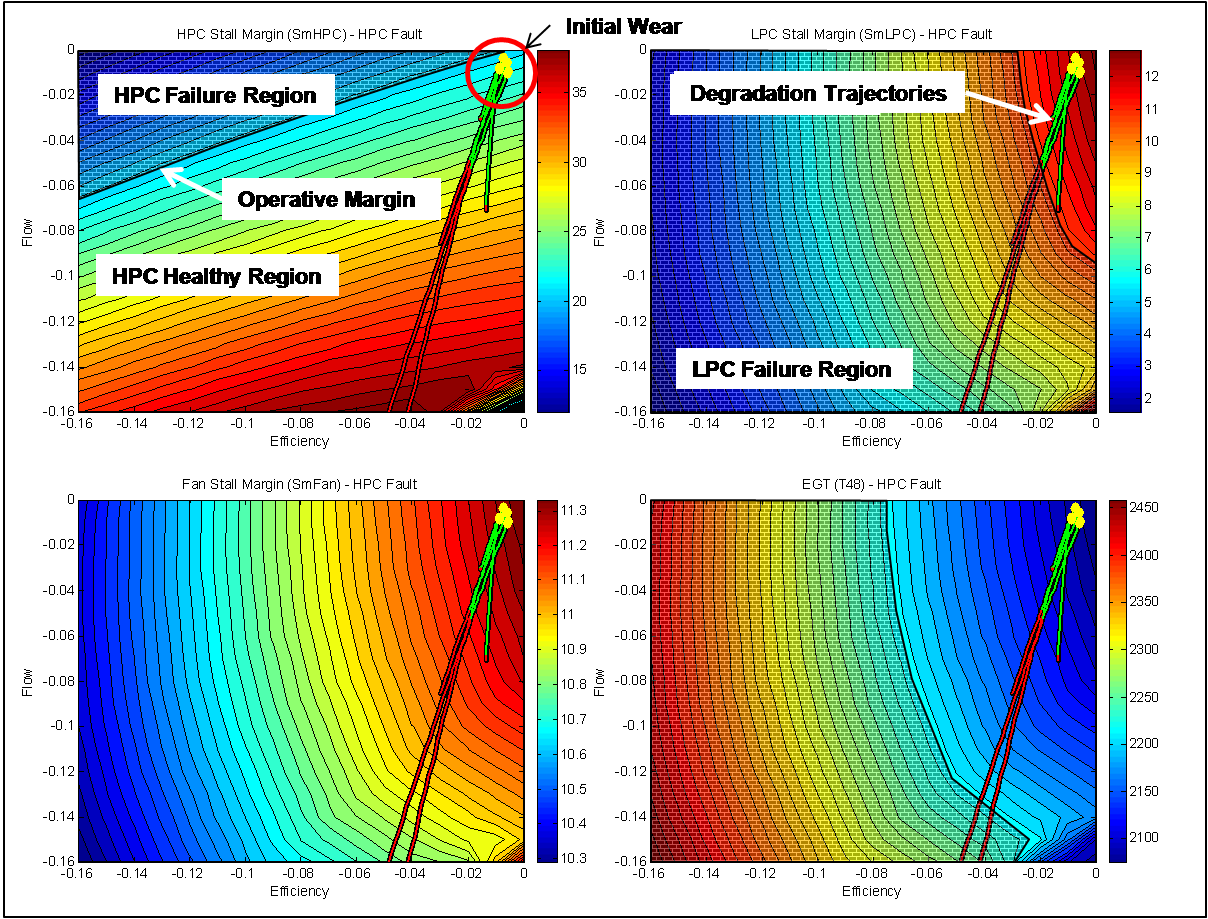
Flow__Efficiency_2-D_Maps.gifGIF
Figure 2
-
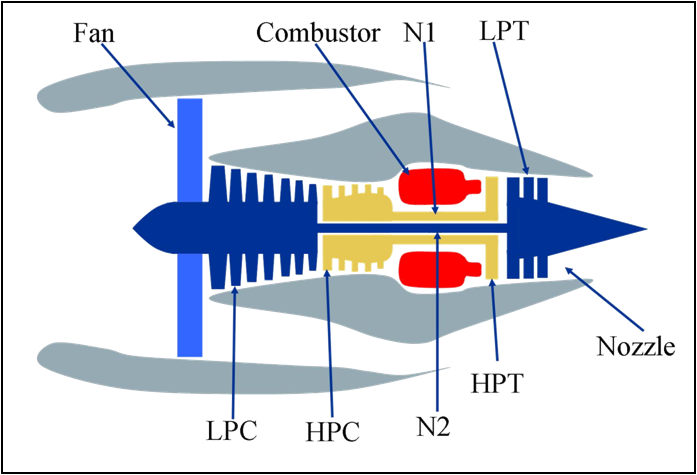
Engine_Schematic.bmpBMP
Figure 3
-
Operative_Margins_3.bmpBMP
Figure 4
-
Landing PageLanding Page
Dates
| Metadata Created Date | November 12, 2020 |
|---|---|
| Metadata Updated Date | April 10, 2025 |
| Data Update Frequency | irregular |
Metadata Source
- Data.json Data.json Metadata
Harvested from NASA Data.json
Additional Metadata
| Resource Type | Dataset |
|---|---|
| Metadata Created Date | November 12, 2020 |
| Metadata Updated Date | April 10, 2025 |
| Publisher | Dashlink |
| Maintainer | |
| Identifier | DASHLINK_14 |
| Data First Published | 2010-09-10 |
| Data Last Modified | 2025-03-31 |
| Public Access Level | public |
| Data Update Frequency | irregular |
| Bureau Code | 026:00 |
| Metadata Context | https://project-open-data.cio.gov/v1.1/schema/catalog.jsonld |
| Schema Version | https://project-open-data.cio.gov/v1.1/schema |
| Catalog Describedby | https://project-open-data.cio.gov/v1.1/schema/catalog.json |
| Harvest Object Id | 5e916822-1b39-4747-910f-ff3450303ecd |
| Harvest Source Id | 58f92550-7a01-4f00-b1b2-8dc953bd598f |
| Harvest Source Title | NASA Data.json |
| Homepage URL | https://c3.nasa.gov/dashlink/resources/14/ |
| Program Code | 026:029 |
| Source Datajson Identifier | True |
| Source Hash | f86e05c888bb03c502865f59eaa83a2e5dde66a61ce0c130ac74ff1f79c90f3e |
| Source Schema Version | 1.1 |
Didn't find what you're looking for? Suggest a dataset here.