NOAA GOES-R Series Advanced Baseline Imager (ABI) Level 2 Derived Stability Indices (DSI)
Access & Use Information
Downloads & Resources
-
NCEI Dataset Landing Page
Landing page for the dataset.
-
NCEI Archive Information Request System
Search the data archive and submit an order for the dataset via the interface.
-
NOAA CLASS Data Search and Order
Search the data archive and submit an order for the dataset via the interface.
-
NCEI GOES-R Terrestrial Weather
Description of the products and related resources.
-
Product Definition and Users' Guide (PUG) Vol.1 MainPDF
The Product Definition and User's Guide (PUG) document provides product...
-
Product Definition and Users' Guide (PUG)...PDF
The Product Definition and User's Guide (PUG) document provides product...
-
Registry of Open Data on AWS
Information on AWS data access.
-
GOES-16 AWS S3 Explorer (Region: us-east-1)HTML
Browse view to explore the S3 bucket for GOES-16 datasets. Data relevant to...
-
GOES-17 AWS S3 Explorer (Region: us-east-1)HTML
Browse view to explore the S3 bucket for GOES-17 datasets. Data relevant to...
-
GOES-18 AWS S3 Explorer (Region: us-east-1)HTML
Browse view to explore the S3 bucket for GOES-18 datasets. Data relevant to...
-
GOES-16 Google Cloud Bucket Explorer (Region:...
Browse view to explore the Google Cloud bucket for GOES-16. Data relevant to...
-
GOES-17 Google Cloud Bucket Explorer (Region:...
Browse view to explore the Google Cloud bucket for GOES-17. Data relevant to...
-
GOES-18 Google Cloud Bucket Explorer (Region:...
Browse view to explore the Google Cloud bucket for GOES-18. Data relevant to...
-
GOES Google Cloud Landing Page (Region: US-multiple)
Information on Google Cloud data access for GOES datasets.
-
Global Change Master Directory (GCMD) Keywords
The information provided on this page seeks to define how the GCMD Keywords...
-
Global Change Master Directory (GCMD) Keywords
The information provided on this page seeks to define how the GCMD Keywords...
-
Global Change Master Directory (GCMD) Keywords
The information provided on this page seeks to define how the GCMD Keywords...
-
Global Change Master Directory (GCMD) Keywords
The information provided on this page seeks to define how the GCMD Keywords...
-
Global Change Master Directory (GCMD) Keywords
The information provided on this page seeks to define how the GCMD Keywords...
-
Global Change Master Directory (GCMD) Keywords
The information provided on this page seeks to define how the GCMD Keywords...
-
Global Change Master Directory (GCMD) Keywords
The information provided on this page seeks to define how the GCMD Keywords...
-
Global Change Master Directory (GCMD) Keywords
The information provided on this page seeks to define how the GCMD Keywords...
-
GOES-R Program Document LibraryHTML
Webpage with product algorithm, users guides, and education and outreach...
-
GOES Operational Status - NOAA Office of...HTML
GOES spacecraft status page.
Dates
| Metadata Date | September 18, 2023 |
|---|---|
| Metadata Created Date | February 3, 2023 |
| Metadata Updated Date | November 2, 2023 |
| Reference Date(s) | February 22, 2018 (publication) |
| Frequency Of Update | continual |
Metadata Source
- ISO-19139 ISO-19139 Metadata
Harvested from ncdc
Graphic Preview

Additional Metadata
| Resource Type | Dataset |
|---|---|
| Metadata Date | September 18, 2023 |
| Metadata Created Date | February 3, 2023 |
| Metadata Updated Date | November 2, 2023 |
| Reference Date(s) | February 22, 2018 (publication) |
| Responsible Party | DOC/NOAA/NESDIS/NCEI > National Centers for Environmental Information, NESDIS, NOAA, U.S. Department of Commerce (Point of Contact) |
| Contact Email | |
| Guid | gov.noaa.ncdc:C01516 |
| Access Constraints | Cite as: GOES-R Algorithm Working Group and GOES-R Series Program, (2018): NOAA GOES-R Series Advanced Baseline Imager (ABI) Level 2 Derived Stability Indices. [indicate subset used]. NOAA National Centers for Environmental information. doi:10.7289/V50Z71KF. [access date]., Distribution liability: NOAA and NCEI make no warranty, expressed or implied, regarding these data, nor does the fact of distribution constitute such a warranty. NOAA and NCEI cannot assume liability for any damages caused by any errors or omissions in these data. If appropriate, NCEI can only certify that the data it distributes are an authentic copy of the records that were accepted for inclusion in the NCEI archives., Use liability: NOAA and NCEI cannot provide any warranty as to the accuracy, reliability, or completeness of furnished data. Users assume responsibility to determine the usability of these data. The user is responsible for the results of any application of this data for other than its intended purpose. |
| Bbox East Long | 6.2995 |
| Bbox North Lat | 81.3282 |
| Bbox South Lat | -81.3282 |
| Bbox West Long | -156.2995 |
| Coupled Resource | |
| Frequency Of Update | continual |
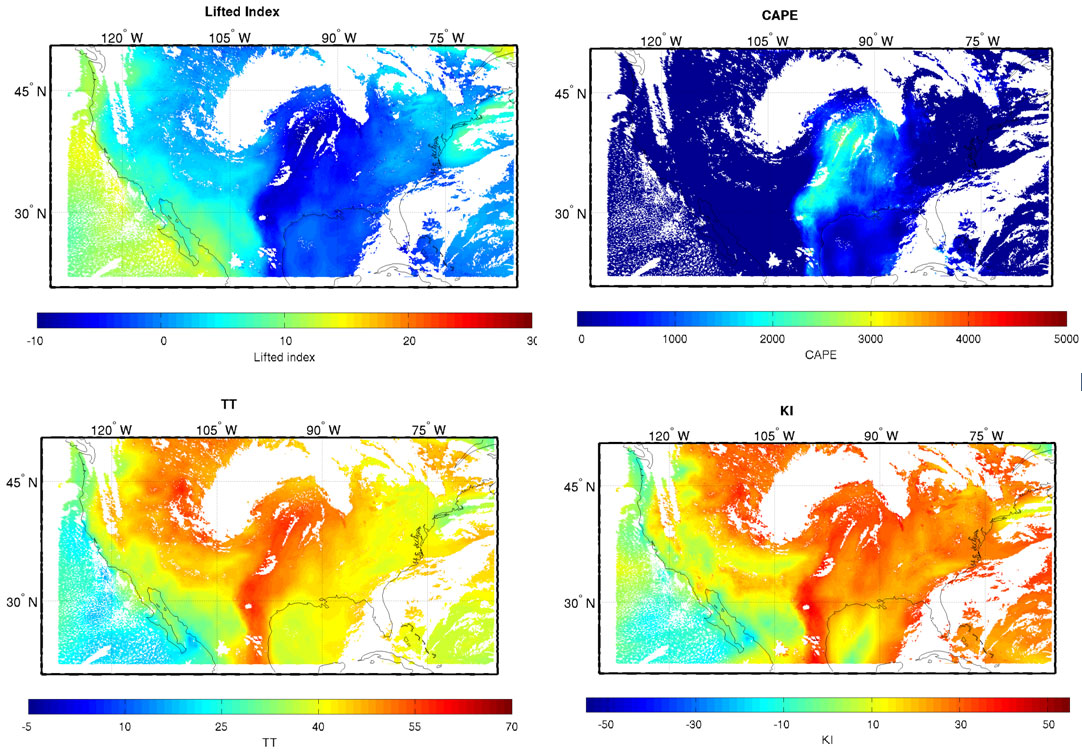
| Graphic Preview Description | Examples of a number of the atmospheric stability products as generated by the GOES-R Temperature, Moisture, and Atmospheric Stability algorithm using simulated GOES-R data on 04 June 2005 22:00 UTC. Stability indices shown include Lifted Index (upper left), CAPE (upper right), Totals Total (lower left) and K-Index (lower right). |
| Graphic Preview File | https://www.ncei.noaa.gov/pub/data/metadata/images/C01516.jpg |
| Graphic Preview Type | JPEG |
| Harvest Object Id | cab036d5-8772-41f5-9f1c-d71c6f38a834 |
| Harvest Source Id | 2cb3ef77-1683-4c2a-9119-dc65e50917c6 |
| Harvest Source Title | ncdc |
| Licence | For a complete description of use limitations for this dataset, refer to the Algorithm Theoretical Basis Document (ATBD). |
| Lineage | These data were produced by the NOAA Office of Satellite and Product Operations (OSPO) and are archived at the NOAA National Centers for Environmental Information (NCEI). |
| Metadata Language | eng; USA |
| Metadata Type | geospatial |
| Old Spatial | {"type": "Polygon", "coordinates": [[[-156.2995, -81.3282], [6.2995, -81.3282], [6.2995, 81.3282], [-156.2995, 81.3282], [-156.2995, -81.3282]]]} |
| Progress | onGoing |
| Spatial Data Service Type | |
| Spatial Reference System | urn:ogc:def:crs:EPSG::4326 |
| Spatial Harvester | True |
| Temporal Extent Begin | 2017-05-16 |
Didn't find what you're looking for? Suggest a dataset here.

