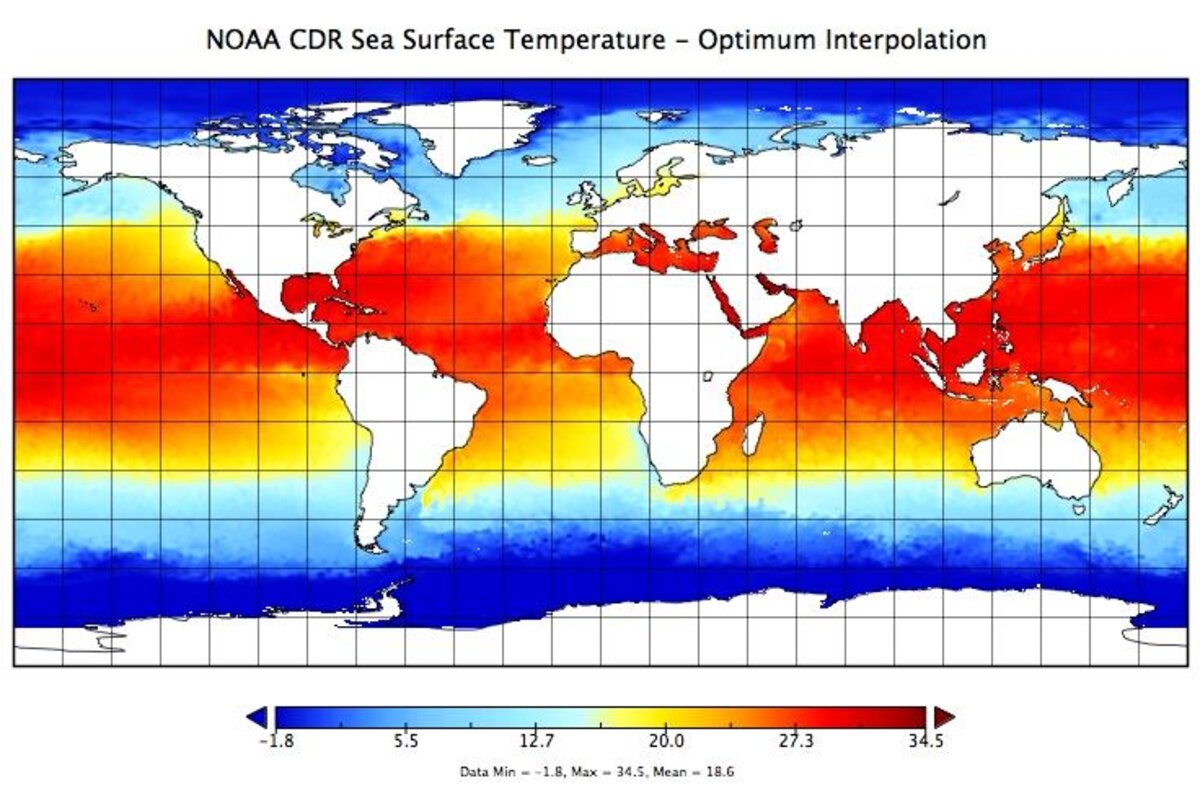
NOAA 0.25-degree Daily Optimum Interpolation Sea Surface Temperature (OISST), Version 2.1
Access & Use Information
Downloads & Resources
-
NCEI Dataset Landing Page
Landing page for the dataset.
-
NCEI CDR Information Page
CDR overview and documentation.
-
NCEI Product Information Page
Description of the data and related resources.
-
NCEI Direct Download (Dataset Files)
Direct download for the dataset.
-
NCEI THREDDSHTML
THREDDS Data Server (TDS) for the dataset.
-
NCEI ERDDAP
ERDDAP Data Service for the dataset.
-
Registry of Open Data on AWS
Information on AWS data access.
-
AWS S3 Explorer (Region: us-east-1)HTML
Browse view to explore the S3 bucket.
-
Azure Landing Page (Region: us-east)HTML
Information on Microsoft Azure data access.
-
Google Earth Engine Page (Region: US-central-1)
Information on Google Earth Engine data access.
-
NOAA National Centers for Environmental...
NCEI home page with information, data access and contact information.
-
Global Change Master Directory (GCMD) Keywords
The information provided on this page seeks to define how the GCMD Keywords...
-
GCOS Essential Climate Variables
Overview of the GCOS Essential Climate Variables.
-
Global Change Master Directory (GCMD) Keywords
The information provided on this page seeks to define how the GCMD Keywords...
-
Global Change Master Directory (GCMD) Keywords
The information provided on this page seeks to define how the GCMD Keywords...
-
Global Change Master Directory (GCMD) Keywords
The information provided on this page seeks to define how the GCMD Keywords...
-
Global Change Master Directory (GCMD) Keywords
The information provided on this page seeks to define how the GCMD Keywords...
-
Journal article published February 2020 in J....
Banzon, V., T.M. Smith, M. Steele, B. Huang, and H. Zhang, 2020: Improved...
-
NCEI landing page for the GHRSST product
Related dataset landing page.
Dates
| Metadata Date | August 10, 2023 |
|---|---|
| Metadata Created Date | October 28, 2022 |
| Metadata Updated Date | September 19, 2023 |
| Reference Date(s) | March 20, 2020 (publication) |
| Frequency Of Update | daily |
Metadata Source
- ISO-19139 ISO-19139 Metadata
Harvested from ncdc
Other Data Resources
- Geoplatform Metadata Information
Graphic Preview

Additional Metadata
| Resource Type | Dataset |
|---|---|
| Metadata Date | August 10, 2023 |
| Metadata Created Date | October 28, 2022 |
| Metadata Updated Date | September 19, 2023 |
| Reference Date(s) | March 20, 2020 (publication) |
| Responsible Party | DOC/NOAA/NESDIS/NCEI > National Centers for Environmental Information, NESDIS, NOAA, U.S. Department of Commerce (Point of Contact) |
| Contact Email | |
| Guid | gov.noaa.ncdc:C01606 |
| Access Constraints | Cite as: Huang, Boyin; Liu, Chunying; Banzon, Viva F.; Freeman, Eric; Graham, Garrett; Hankins, William; Smith, Thomas M.; Zhang, Huai-Min. (2020): NOAA 0.25-degree Daily Optimum Interpolation Sea Surface Temperature (OISST), Version 2.1. [indicate subset used]. NOAA National Centers for Environmental Information. https://doi.org/10.25921/RE9P-PT57. Accessed [date]., See the Use Agreement for this CDR available on the CDR page., Distribution liability: NOAA and NCEI make no warranty, expressed or implied, regarding these data, nor does the fact of distribution constitute such a warranty. NOAA and NCEI cannot assume liability for any damages caused by any errors or omissions in these data. If appropriate, NCEI can only certify that the data it distributes are an authentic copy of the records that were accepted for inclusion in the NCEI archives., Use liability: NOAA and NCEI cannot provide any warranty as to the accuracy, reliability, or completeness of furnished data. Users assume responsibility to determine the usability of these data. The user is responsible for the results of any application of this data for other than its intended purpose. |
| Bbox East Long | 180.0 |
| Bbox North Lat | 90.0 |
| Bbox South Lat | -90.0 |
| Bbox West Long | -180.0 |
| Coupled Resource | |
| Frequency Of Update | daily |
| Graphic Preview Description | Sea Surface Temperature image |
| Graphic Preview File | https://www.ncei.noaa.gov/pub/data/metadata/images/C01606.jpg |
| Graphic Preview Type | JPEG |
| Harvest Object Id | a103adae-bc17-4e41-a586-0e7ffd0923f4 |
| Harvest Source Id | 2cb3ef77-1683-4c2a-9119-dc65e50917c6 |
| Harvest Source Title | ncdc |
| Licence | |
| Lineage | This dataset was produced by and is archived at the NOAA National Centers for Environmental Information (NCEI). |
| Metadata Language | eng; USA |
| Metadata Type | geospatial |
| Old Spatial | {"type": "Polygon", "coordinates": [[[-180.0, -90.0], [180.0, -90.0], [180.0, 90.0], [-180.0, 90.0], [-180.0, -90.0]]]} |
| Progress | onGoing |
| Spatial Data Service Type | |
| Spatial Reference System | |
| Spatial Harvester | True |
| Temporal Extent Begin | 1981-09-01 |
Didn't find what you're looking for? Suggest a dataset here.


