U.S. flag

An official website of the United States government

Official websites use .gov
A .gov website belongs to an official government organization in the United States.

Secure .gov websites use HTTPS
A lock ( ) or https:// means you’ve safely connected to the .gov website. Share sensitive information only on official, secure websites.

Skip to content

Integrated Building Health Management

Metadata Updated: December 6, 2023

Abstract:

Building health management is an important part in running an efficient and cost-effective building. Many problems in a building’s system can go undetected for long periods of time, leading to expensive repairs or wasted resources. This project aims to help detect and diagnose the building‘s health with data driven methods throughout the day. Orca and IMS are two state of the art algorithms that observe an array of building health sensors and provide feedback on the overall system’s health as well as localize the problem to one, or possibly two, components. With this level of feedback the hope is to quickly identify problems and provide appropriate maintenance while reducing the number of complaints and service calls.

Introduction:

To prepare these technologies for the new installation, the proposed methods are being tested on a current system that behaves similarly to the future green building. Building 241 was determined to best resemble the proposed building 232 and therefore was chosen for this study. Building 241 is currently outfitted with 34 sensors that monitor the heating & cooling temperatures for the air and water systems as well as other various subsystem states. The daily sensor recordings were logged and sent to the IDU group for analysis. The period of analysis was focused from July 1st through August 10th 2009.

Methodology:

The two algorithms used for analysis were Orca and IMS. Both methods look for anomalies using a distanced based scoring approach. Orca has the ability to use a single data set and find outliers within that data set. This tactic was applied to each day. After scoring each time sample throughout a given day the Orca score profiles were compared by computing the correlation against all other days. Days with high overall correlations were considered normal however days with lower overall correlations were more anomalous. IMS, on the other hand, needs a normal set of data to build a model, which can be applied to a set of test data to asses how anomaly the particular data set is. The typical days identified by Orca were used as the reference/training set for IMS, while all the other days were passed through IMS resulting in an anomaly score profile for each day. The mean of the IMS score profile was then calculated for each day to produce a summary IMS score. These summary scores were ranked and the top outliers were identified (see Figure 1). Once the anomalies were identified the contributing parameters were then ranked by the algorithm.

Analysis:

The contributing parameters identified by IMS were localized to the return air temperature duct system.

-7/03/09 (Figure 2 & 3) AHU-1 Return Air Temperature (RAT) Calculated Average Return Air Temperature -7/19/09 (Figure 3 & 4) AHU-2 Return Air Temperature (RAT) Calculated Average Return Air Temperature

IMS identified significantly higher temperatures compared to other days during the month of July and August.

Conclusion:

The proposed algorithms Orca and IMS have shown that they were able to pick up significant anomalies in the building system as well as diagnose the anomaly by identifying the sensor values that were anomalous. In the future these methods can be used on live streaming data and produce a real time anomaly score to help building maintenance with detection and diagnosis of problems.

Access & Use Information

Public: This dataset is intended for public access and use. License: No license information was provided. If this work was prepared by an officer or employee of the United States government as part of that person's official duties it is considered a U.S. Government Work.

Downloads & Resources
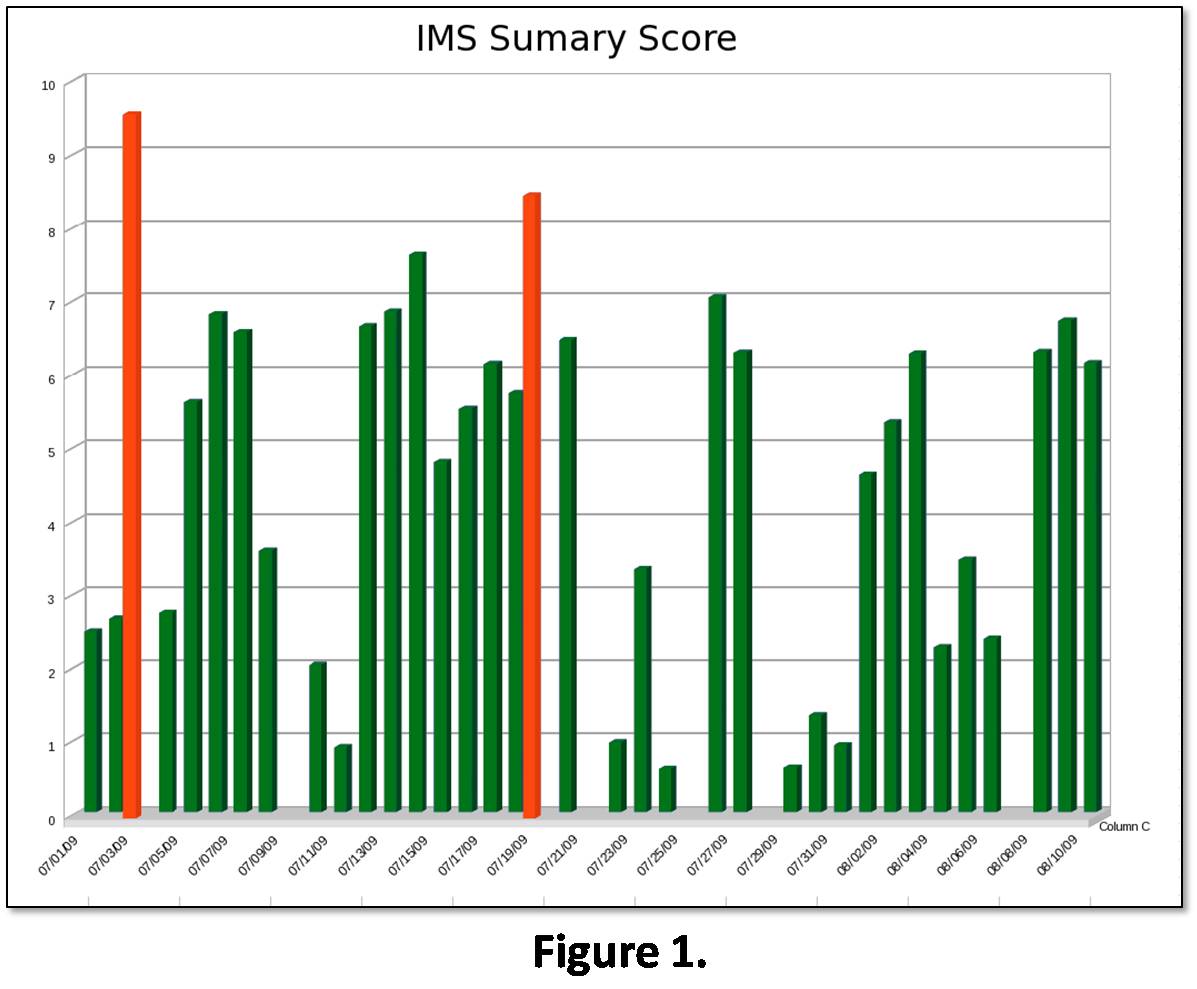
Dates

Metadata Created Date November 12, 2020
Metadata Updated Date December 6, 2023
Data Update Frequency irregular

Metadata Source

Harvested from NASA Data.json

Additional Metadata

Resource Type Dataset
Metadata Created Date November 12, 2020
Metadata Updated Date December 6, 2023
Publisher Dashlink
Maintainer
Identifier DASHLINK_217
Data First Published 2010-09-22
Data Last Modified 2020-01-29
Public Access Level public
Data Update Frequency irregular
Bureau Code 026:00
Metadata Context https://project-open-data.cio.gov/v1.1/schema/catalog.jsonld
Metadata Catalog ID https://data.nasa.gov/data.json
Schema Version https://project-open-data.cio.gov/v1.1/schema
Catalog Describedby https://project-open-data.cio.gov/v1.1/schema/catalog.json
Harvest Object Id 0f8b6a56-aa11-4f8a-a8e1-c9dd11c2e070
Harvest Source Id 58f92550-7a01-4f00-b1b2-8dc953bd598f
Harvest Source Title NASA Data.json
Homepage URL https://c3.nasa.gov/dashlink/resources/217/
Program Code 026:029
Source Datajson Identifier True
Source Hash 233e3d7eb49b113f59509d307cf3780bab5278db78065a1dbb1faa13ba5cadbc
Source Schema Version 1.1

Didn't find what you're looking for? Suggest a dataset here.