Gross Primary Production Maps of Tidal Wetlands across Conterminous USA, 2000-2019
Access & Use Information
Downloads & Resources
-
Google Scholar search resultsHTML
Search results for publications that cite this dataset by its DOI.
-
Download this datasetHTML
This link allows direct data access via Earthdata login
-
View documentation related to this datasetHTML
ORNL DAAC Data Set Documentation
-
This dataset's landing pageHTML
Data set Landing Page DOI URL
-
View documentation related to this datasetPDF
Gross Primary Production Maps of Tidal Wetlands across Conterminous USA,...
-
Get a related visualizationPNG
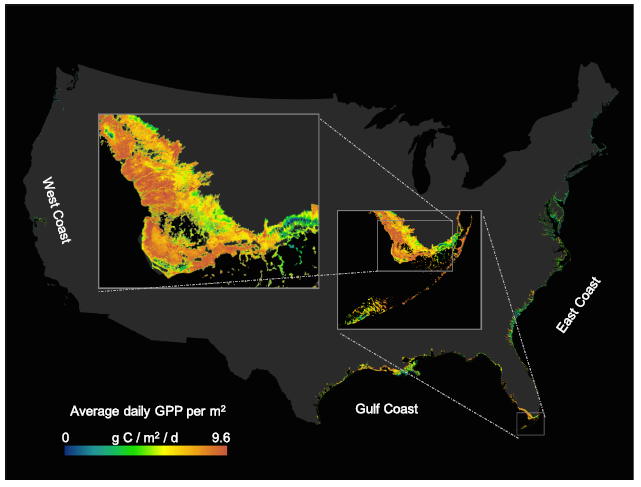
Example of average daily gross primary production (GPP) per m2 at 250 m...
-
Landing PageLanding Page
Dates
| Metadata Created Date | December 1, 2022 |
|---|---|
| Metadata Updated Date | December 6, 2023 |
Metadata Source
- Data.json Data.json Metadata
Harvested from NASA Data.json
Graphic Preview

Additional Metadata
| Resource Type | Dataset |
|---|---|
| Metadata Created Date | December 1, 2022 |
| Metadata Updated Date | December 6, 2023 |
| Publisher | ORNL_DAAC |
| Maintainer | |
| Identifier | C2389119490-ORNL_CLOUD |
| Data First Published | 2020-09-24 |
| Language | en-US |
| Data Last Modified | 2023-06-12 |
| Category | CMS, geospatial |
| Public Access Level | public |
| Bureau Code | 026:00 |
| Metadata Context | https://project-open-data.cio.gov/v1.1/schema/catalog.jsonld |
| Metadata Catalog ID | https://data.nasa.gov/data.json |
| Schema Version | https://project-open-data.cio.gov/v1.1/schema |
| Catalog Describedby | https://project-open-data.cio.gov/v1.1/schema/catalog.json |
| Citation | Feagin, R.A., I. Forbrich, T.P. Huff, J.G. Barr, J. Ruiz-plancarte, J.D Fuentes, R.G. Najjar, R. Vargas, A. Vazquez-lule, L. Windham-Myers, K. Kroeger, E.J. Ward, G.W. Moore, M. Leclerc, K.W. Krauss, C.L. Stagg, M. Alber, S.H. Knox, K.V.R. Schafer, T.S. Bianchi, J.A. Hutchings, H.B. Nahrawi, A. Noormets, B. Mitra, A. Jaimes, A.L. Hinson, B. Bergamaschi, J. King, and G. Miao. 2020. Gross Primary Production Maps of Tidal Wetlands across Conterminous USA, 2000-2019. ORNL DAAC, Oak Ridge, Tennessee, USA. https://doi.org/10.3334/ORNLDAAC/1792 |
| Graphic Preview Description | Example of average daily gross primary production (GPP) per m2 at 250 m resolution shown for wetlands in the North and South Ten Thousand Islands in the Florida Everglades. Mapped values are an average of all 16-day periods from 2000-2019. Source: Feagin et al., 2020 |
| Graphic Preview File | https://daac.ornl.gov/CMS/guides/Tidal_Wetland_GPP_CONUS_Fig1.png |
| Harvest Object Id | 7bf0d1f9-4cc8-4ab2-a99e-721157b8e708 |
| Harvest Source Id | 58f92550-7a01-4f00-b1b2-8dc953bd598f |
| Harvest Source Title | NASA Data.json |
| Homepage URL | https://doi.org/10.3334/ORNLDAAC/1792 |
| Metadata Type | geospatial |
| Old Spatial | -128.03 23.5 -65.9 47.7 |
| Program Code | 026:001 |
| Source Datajson Identifier | True |
| Source Hash | faefece0a86ec0918d65603dbd04c227e64c6312ead88da4146b4c3ad0e852b0 |
| Source Schema Version | 1.1 |
| Spatial | |
| Temporal | 2000-03-05T00:00:00Z/2019-11-17T23:59:59Z |
Didn't find what you're looking for? Suggest a dataset here.

