Gridded CO2 and CH4 Flux Estimates for pan-Arctic and Boreal Regions, 2003-2015
Access & Use Information
Downloads & Resources
-
Google Scholar search resultsHTML
Search results for publications that cite this dataset by its DOI.
-
Download this datasetHTML
This link allows direct data access via Earthdata login
-
View documentation related to this datasetHTML
ORNL DAAC Data Set Documentation
-
This dataset's landing pageHTML
Data set Landing Page DOI URL
-
Use OPeNDAP to access the dataset's dataHTML
USE SERVICE API
-
View documentation related to this datasetPDF
Gridded CO2 and CH4 Flux Estimates for pan-Arctic and Boreal Regions,...
-
Get a related visualizationPNG
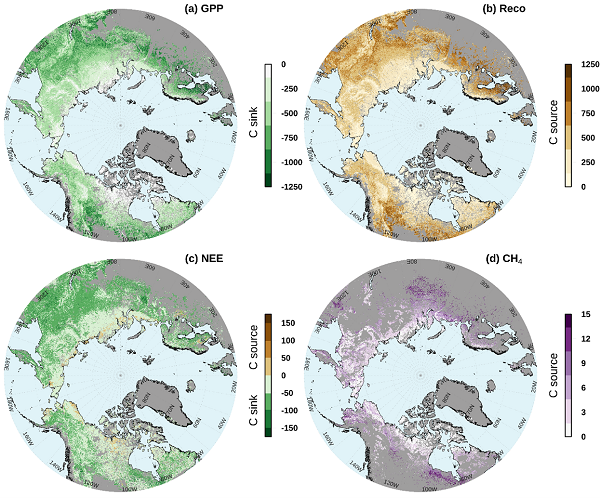
Average annual carbon flux (g m-2 yr-1) across the Arctic-boreal domain from...
-
The dataset's project home pageHTML
ABoVE project site
-
Landing PageLanding Page
Dates
| Metadata Created Date | March 28, 2024 |
|---|---|
| Metadata Updated Date | March 28, 2024 |
Metadata Source
- Data.json Data.json Metadata
Harvested from NASA Data.json
Other Data Resources
- Geoplatform Metadata Information
Graphic Preview

Additional Metadata
| Resource Type | Dataset |
|---|---|
| Metadata Created Date | March 28, 2024 |
| Metadata Updated Date | March 28, 2024 |
| Publisher | ORNL_DAAC |
| Maintainer | |
| Identifier | C2909734357-ORNL_CLOUD |
| Data First Published | 2024-03-22 |
| Language | en-US |
| Data Last Modified | 2024-03-26 |
| Category | ABoVE, geospatial |
| Public Access Level | public |
| Bureau Code | 026:00 |
| Metadata Context | https://project-open-data.cio.gov/v1.1/schema/catalog.jsonld |
| Metadata Catalog ID | https://data.nasa.gov/data.json |
| Schema Version | https://project-open-data.cio.gov/v1.1/schema |
| Catalog Describedby | https://project-open-data.cio.gov/v1.1/schema/catalog.json |
| Citation | Farina, M.K., and J.D. Watts. 2022. Gridded CO2 and CH4 Flux Estimates for pan-Arctic and Boreal Regions, 2003-2015. ORNL DAAC, Oak Ridge, Tennessee, USA. https://doi.org/10.3334/ORNLDAAC/2121 |
| Graphic Preview Description | Average annual carbon flux (g m-2 yr-1) across the Arctic-boreal domain from 2003-2015 as informed by daily 1-km TCFM-Arctic simulations: a) GPP, b) Reco, c) NEE, and d) tundra and boreal wetland CH4 emissions with a topographic wetness index (TWI) masking. |
| Graphic Preview File | https://daac.ornl.gov/ABOVE/guides/ABoVE_CO2_CH4_Flux_Estimates_Fig1.png |
| Harvest Object Id | 81e758c4-3c9b-4a07-ab59-b35a6658cebe |
| Harvest Source Id | 58f92550-7a01-4f00-b1b2-8dc953bd598f |
| Harvest Source Title | NASA Data.json |
| Homepage URL | https://doi.org/10.3334/ORNLDAAC/2121 |
| Metadata Type | geospatial |
| Old Spatial | -180.0 49.0 180.0 90.0 |
| Program Code | 026:001 |
| Source Datajson Identifier | True |
| Source Hash | c7a36e1298e6249a63da9447fc52e1840557fdadb405ee4d6b645e213c080f4f |
| Source Schema Version | 1.1 |
| Spatial | |
| Temporal | 2003-01-01T00:00:00Z/2015-12-31T23:59:59Z |
Didn't find what you're looking for? Suggest a dataset here.


