Global Mangrove Loss Extent, Land Cover Change, and Loss Drivers, 2000-2016
Access & Use Information
Downloads & Resources
-
Google Scholar search resultsHTML
Search results for publications that cite this dataset by its DOI.
-
Download this datasetHTML
This link allows direct data access via Earthdata login
-
View documentation related to this datasetHTML
ORNL DAAC Data Set Documentation
-
This dataset's landing pageHTML
Data set Landing Page DOI URL
-
View documentation related to this datasetPDF
Global Mangrove Loss Extent, Land Cover Change, and Loss Drivers, 2000-2016:...
-
View documentation related to this datasetPDF
Global Mangrove Loss Extent, Land Cover Change, and Loss Drivers, 2000-2016:...
-
Get a related visualizationJPEG
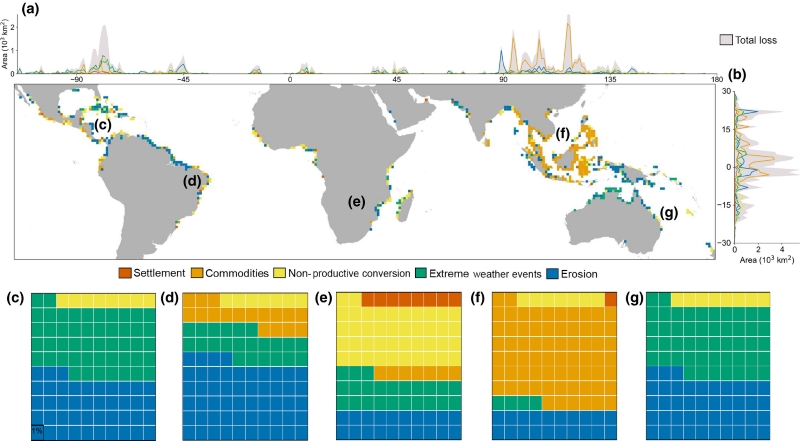
Global distribution of mangrove loss and its drivers. (a) The longitudinal...
-
Landing PageLanding Page
Dates
| Metadata Created Date | December 1, 2022 |
|---|---|
| Metadata Updated Date | December 7, 2023 |
Metadata Source
- Data.json Data.json Metadata
Harvested from NASA Data.json
Graphic Preview

Additional Metadata
| Resource Type | Dataset |
|---|---|
| Metadata Created Date | December 1, 2022 |
| Metadata Updated Date | December 7, 2023 |
| Publisher | ORNL_DAAC |
| Maintainer | |
| Identifier | C2389103604-ORNL_CLOUD |
| Data First Published | 2022-03-17 |
| Language | en-US |
| Data Last Modified | 2023-06-12 |
| Category | CMS, geospatial |
| Public Access Level | public |
| Bureau Code | 026:00 |
| Metadata Context | https://project-open-data.cio.gov/v1.1/schema/catalog.jsonld |
| Metadata Catalog ID | https://data.nasa.gov/data.json |
| Schema Version | https://project-open-data.cio.gov/v1.1/schema |
| Catalog Describedby | https://project-open-data.cio.gov/v1.1/schema/catalog.json |
| Citation | Goldberg, L., D. Lagomasino, N. Thomas, and T. Fatoyinbo. 2022. Global Mangrove Loss Extent, Land Cover Change, and Loss Drivers, 2000-2016. ORNL DAAC, Oak Ridge, Tennessee, USA. https://doi.org/10.3334/ORNLDAAC/1768 |
| Graphic Preview Description | Global distribution of mangrove loss and its drivers. (a) The longitudinal distribution of total mangrove loss and the relative contribution of its primary drivers. Different colors represent unique drivers of mangrove loss. (b) The latitudinal distribution of total mangrove loss and the relative contribution of its primary drivers. (c-g) Global distribution of mangrove loss and associated drivers from 2000 to 2016 at 1-degree x 1-degree resolution, with the relative contribution (percentage) of primary drivers per continent: (c) North America, (d) South America, (e) Africa, (f) Asia, (g) Australia together with Oceania. Source: Goldberg et al. (2020) |
| Graphic Preview File | https://daac.ornl.gov/CMS/guides/CMS_Global_Mangrove_Loss_Fig1.jpg |
| Harvest Object Id | 676befe7-9d18-4c3d-8b0e-0a296741e529 |
| Harvest Source Id | 58f92550-7a01-4f00-b1b2-8dc953bd598f |
| Harvest Source Title | NASA Data.json |
| Homepage URL | https://doi.org/10.3334/ORNLDAAC/1768 |
| Metadata Type | geospatial |
| Old Spatial | -94.56 -58.45 164.69 27.04 |
| Program Code | 026:001 |
| Source Datajson Identifier | True |
| Source Hash | 86d3e8d95c5dccb8f738ae32acd8ebc107501e7baa65ee556d97cf73e8dc7ef6 |
| Source Schema Version | 1.1 |
| Spatial | |
| Temporal | 2000-01-01T00:00:00Z/2016-12-31T23:59:59Z |
Didn't find what you're looking for? Suggest a dataset here.

