Fish, Benthic and Urchin Survey Data from Kahekili Herbivore Fisheries Management Area (HFMA), Maui since 2008
Access & Use Information
Downloads & Resources
-
KHFMA_Data_Dictionary.csv
Data Dictionary
-
KHFMA_Data_Archive_2008to2021.csv
Summarized fish, benthic and urchin data from monitoring surveys within the...
-
Full Metadata Record
View the complete metadata record on InPort for more information about this...
-
Pacific Islands Fisheries Science Center Website
Pacific Island Fisheries Science Center homepage
-
Citation URL
Kahekili Herbivore Fisheries Management Area Facebook page.
-
Global Change Master Directory (GCMD) Keywords
10 views
The information provided on this page seeks to define how the GCMD Keywords...
-
NOAA Data Management Plan (DMP)PDF
NOAA Data Management Plan for this record on InPort.
Dates
| Metadata Date | February 29, 2024 |
|---|---|
| Metadata Created Date | June 16, 2022 |
| Metadata Updated Date | March 16, 2024 |
| Reference Date(s) | 2016-04 (creation), 2022-06 (revision), 2022 (publication) |
| Frequency Of Update | annually |
Metadata Source
- ISO-19139 ISO-19139 Metadata
Harvested from NMFS PIFSC
Graphic Preview

Additional Metadata
| Resource Type | Dataset |
|---|---|
| Metadata Date | February 29, 2024 |
| Metadata Created Date | June 16, 2022 |
| Metadata Updated Date | March 16, 2024 |
| Reference Date(s) | 2016-04 (creation), 2022-06 (revision), 2022 (publication) |
| Responsible Party | (Point of Contact, Custodian) |
| Contact Email | |
| Guid | gov.noaa.nmfs.inport:30951 |
| Access Constraints | Cite As: Pacific Islands Fisheries Science Center, [Date of Access]: Fish, Benthic and Urchin Survey Data from Kahekili Herbivore Fisheries Management Area (HFMA), Maui since 2008 [Data Date Range], https://www.fisheries.noaa.gov/inport/item/30951., Access Constraints: None, Use Constraints: Please cite Ecosystem Sciences Division (ESD) and acknowledge Hawaii Division of Aquatic Resources (HDAR) when using the data. Example: Cite as: Williams, Ivor; PIFSC Coral Reef Ecosystem Program (2017). Fish, Benthic and Urchin Survey Data from Kahekili Herbivore Fisheries Management Area (HFMA), Maui, HI since 2008 (NCEI Accession 0165015). Version 1.1. NOAA National Centers for Environmental Information. Dataset. [access date], Distribution Liability: While every effort has been made to ensure that these data are accurate and reliable within the limits of the current state of the art, NOAA cannot assume liability for any damages caused by errors or omissions in the data, nor as a result of the failure of the data to function on a particular system. NOAA makes no warranty, expressed or implied, nor does the fact of distribution constitute such a warranty. |
| Bbox East Long | -156.6867 |
| Bbox North Lat | 20.9542 |
| Bbox South Lat | 20.9263 |
| Bbox West Long | -156.6983 |
| Coupled Resource | |
| Frequency Of Update | annually |
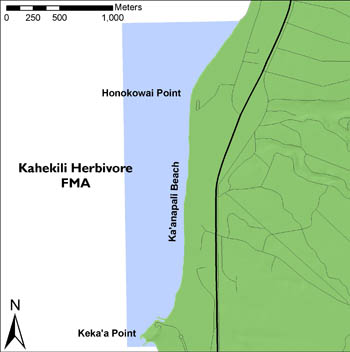
| Graphic Preview Description | Map of Kahekili Herbivore Fishery Management Area |
| Graphic Preview File | http://dlnr.hawaii.gov/dar/files/2014/05/kahekili.jpg |
| Graphic Preview Type | JPG |
| Harvest Object Id | 5ab38fa1-ff9b-406f-8659-e85c336585c0 |
| Harvest Source Id | c0beac72-5f43-4455-8c33-1b345fbc2dfe |
| Harvest Source Title | NMFS PIFSC |
| Licence | NOAA provides no warranty, nor accepts any liability occurring from any incomplete, incorrect, or misleading data, or from any incorrect, incomplete, or misleading use of the data. It is the responsibility of the user to determine whether or not the data is suitable for the intended purpose. |
| Lineage | Belt transect fish surveys are investigations that provide a high degree of taxonomic resolution for reef fish communities. The surveys were conducted by teams of two divers with locations haphazardly spread throughout the survey area. Transect placement was guided by: (1) a focus on hardbottom communities; (2) deploying lines along an isobath and parallel to shore. |
| Metadata Language | eng |
| Metadata Type | geospatial |
| Old Spatial | {"type": "Polygon", "coordinates": [[[-156.6983, 20.9263], [-156.6867, 20.9263], [-156.6867, 20.9542], [-156.6983, 20.9542], [-156.6983, 20.9263]]]} |
| Progress | completed |
| Spatial Data Service Type | |
| Spatial Reference System | |
| Spatial Harvester | True |
| Temporal Extent Begin | 2008 |
| Temporal Extent End | 2021-11-01 |
Didn't find what you're looking for? Suggest a dataset here.

