ABoVE: Active Layer Thickness from Remote Sensing Permafrost Model, Alaska, 2001-2015
Access & Use Information
Downloads & Resources
-
Google Scholar search resultsHTML
Search results for publications that cite this dataset by its DOI.
-
Download this datasetHTML
This link allows direct data access via Earthdata login
-
View documentation related to this datasetHTML
ORNL DAAC Data Set Documentation
-
This dataset's landing pageHTML
Data set Landing Page DOI URL
-
Use OPeNDAP to access the dataset's dataHTML
USE SERVICE API
-
View documentation related to this datasetPDF
ABoVE: Satellite-based Active Layer Thickness Maps, Alaska, 2001-2015:...
-
Get a related visualizationPNG
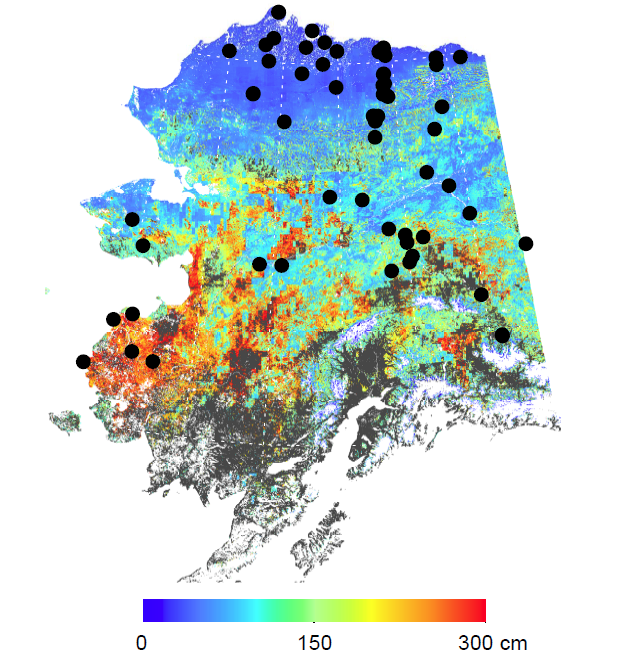
Model-simulated 1 km mean active layer thickness (ALT) map from 2001 to 2015....
-
The dataset's project home pageHTML
ABoVE project site
-
Landing PageLanding Page
Dates
| Metadata Created Date | December 1, 2022 |
|---|---|
| Metadata Updated Date | December 7, 2023 |
Metadata Source
- Data.json Data.json Metadata
Harvested from NASA Data.json
Graphic Preview

Additional Metadata
| Resource Type | Dataset |
|---|---|
| Metadata Created Date | December 1, 2022 |
| Metadata Updated Date | December 7, 2023 |
| Publisher | ORNL_DAAC |
| Maintainer | |
| Identifier | C2143402571-ORNL_CLOUD |
| Data First Published | 2020-05-06 |
| Language | en-US |
| Data Last Modified | 2023-07-17 |
| Category | ABoVE, geospatial |
| Public Access Level | public |
| Bureau Code | 026:00 |
| Metadata Context | https://project-open-data.cio.gov/v1.1/schema/catalog.jsonld |
| Metadata Catalog ID | https://data.nasa.gov/data.json |
| Schema Version | https://project-open-data.cio.gov/v1.1/schema |
| Catalog Describedby | https://project-open-data.cio.gov/v1.1/schema/catalog.json |
| Citation | Yi, Y., and J.S. Kimball. 2020. ABoVE: Active Layer Thickness from Remote Sensing Permafrost Model, Alaska, 2001-2015. ORNL DAAC, Oak Ridge, Tennessee, USA. https://doi.org/10.3334/ORNLDAAC/1760 |
| Graphic Preview Description | Model-simulated 1 km mean active layer thickness (ALT) map from 2001 to 2015. Black dots are locations of circumpolar active layer monitoring (CALM) sites used for comparison of observed ALT to modeled ALT. CALM data are not provided. The areas with ALT greater than 300 cm depth are shown in dark gray. (Source: Yi et al. 2018) |
| Graphic Preview File | https://daac.ornl.gov/ABOVE/guides/Sat_ActiveLayer_Thickness_Maps_Fig1.png |
| Harvest Object Id | 4af828d3-52a6-4514-b8d2-adb594bba68f |
| Harvest Source Id | 58f92550-7a01-4f00-b1b2-8dc953bd598f |
| Harvest Source Title | NASA Data.json |
| Homepage URL | https://doi.org/10.3334/ORNLDAAC/1760 |
| Metadata Type | geospatial |
| Old Spatial | -179.18 55.57 -132.58 70.21 |
| Program Code | 026:001 |
| Source Datajson Identifier | True |
| Source Hash | 13c434533fabf5eb0866d17feb3d208b8a740333cdc19d28b4354f981410a0ed |
| Source Schema Version | 1.1 |
| Spatial | |
| Temporal | 2001-01-01T00:00:00Z/2015-12-31T23:59:59Z |
Didn't find what you're looking for? Suggest a dataset here.

