ABoVE: Landsat Tundra Greenness and Summer Air Temperatures, Arctic Tundra, 1985-2016
Access & Use Information
Downloads & Resources
-
Google Scholar search resultsHTML
Search results for publications that cite this dataset by its DOI.
-
Download this datasetHTML
This link allows direct data access via Earthdata login
-
View documentation related to this datasetHTML
ORNL DAAC Data Set Documentation
-
This dataset's landing pageHTML
Data set Landing Page DOI URL
-
View documentation related to this datasetPDF
ABoVE: Landsat Tundra Greenness and Summer Air Temperatures, Arctic Tundra,...
-
Get a related visualizationPNG
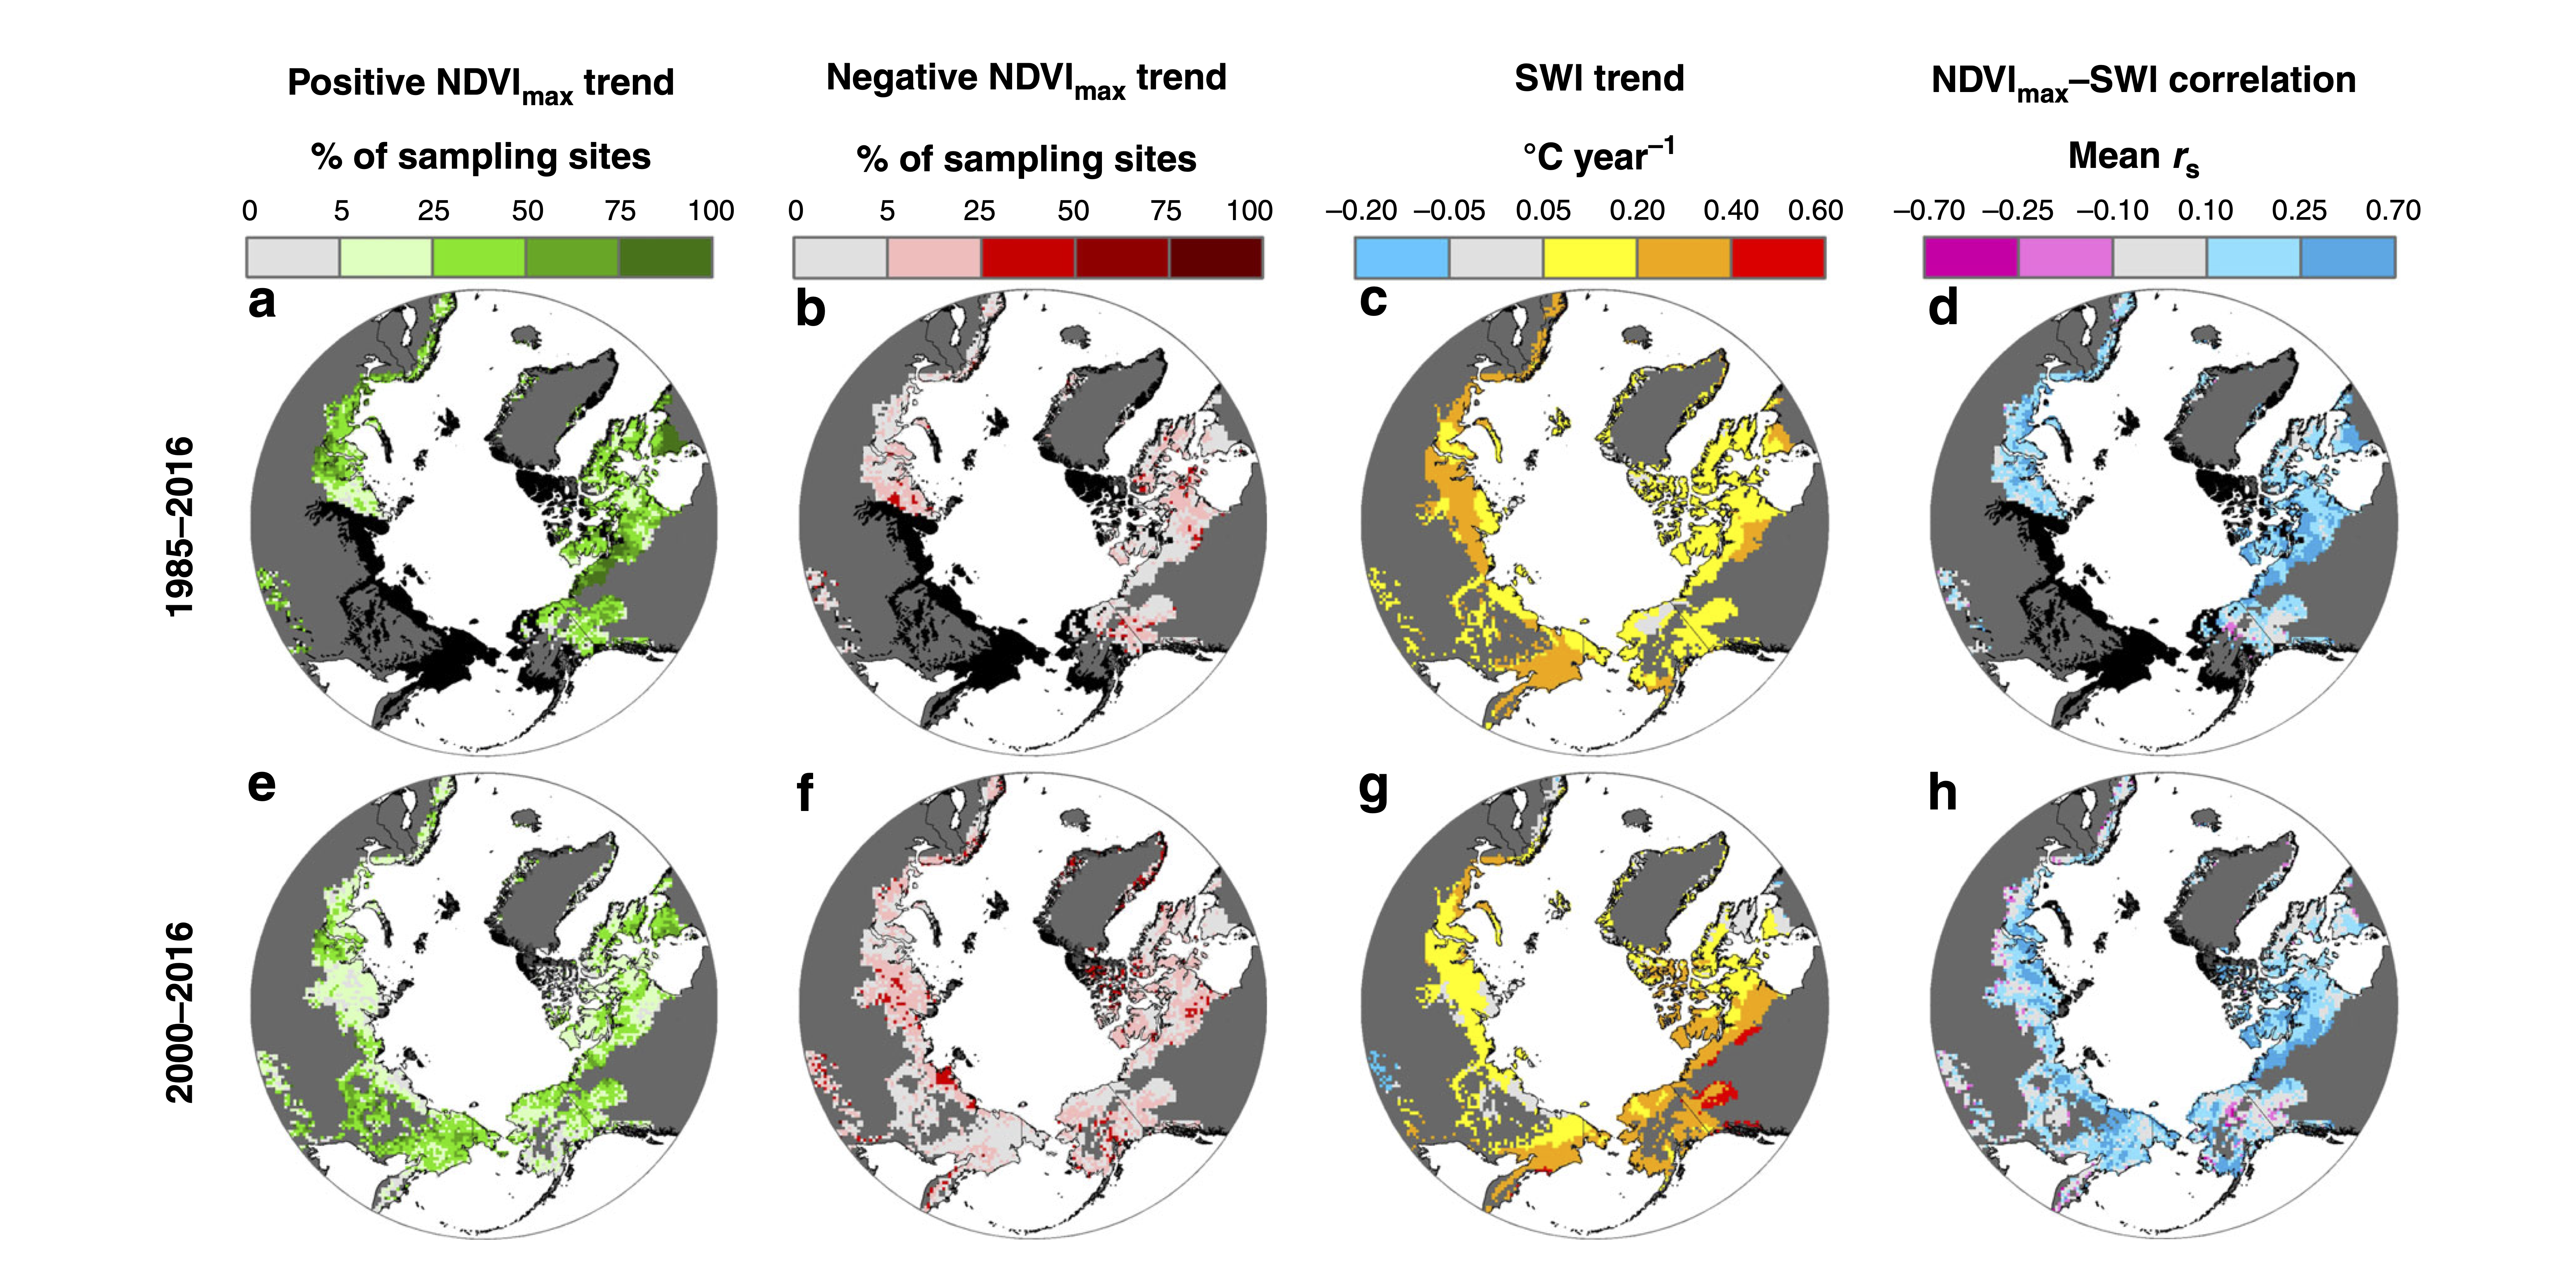
Tundra greenness and summer air temperature trends and correlations across...
-
The dataset's project home pageHTML
ABoVE project site
-
Landing PageLanding Page
Dates
| Metadata Created Date | December 1, 2022 |
|---|---|
| Metadata Updated Date | December 7, 2023 |
Metadata Source
- Data.json Data.json Metadata
Harvested from NASA Data.json
Other Data Resources
- Geoplatform Metadata Information
Graphic Preview

Additional Metadata
| Resource Type | Dataset |
|---|---|
| Metadata Created Date | December 1, 2022 |
| Metadata Updated Date | December 7, 2023 |
| Publisher | ORNL_DAAC |
| Maintainer | |
| Identifier | C2143401680-ORNL_CLOUD |
| Data First Published | 2021-09-17 |
| Language | en-US |
| Data Last Modified | 2023-06-12 |
| Category | ABoVE, geospatial |
| Public Access Level | public |
| Bureau Code | 026:00 |
| Metadata Context | https://project-open-data.cio.gov/v1.1/schema/catalog.jsonld |
| Metadata Catalog ID | https://data.nasa.gov/data.json |
| Schema Version | https://project-open-data.cio.gov/v1.1/schema |
| Catalog Describedby | https://project-open-data.cio.gov/v1.1/schema/catalog.json |
| Citation | Berner, L.T., R. Massey, and S.J. Goetz. 2021. ABoVE: Landsat Tundra Greenness and Summer Air Temperatures, Arctic Tundra, 1985-2016. ORNL DAAC, Oak Ridge, Tennessee, USA. https://doi.org/10.3334/ORNLDAAC/1893 |
| Graphic Preview Description | Tundra greenness and summer air temperature trends and correlations across the Arctic. Top panels (a-d) depict Landsat annual maximum Normalized Difference Vegetation Index (NDVImax) trends, summer warmth index (SWI) trends derived using an ensemble of five temperature datasets, and mean Spearmans correlation (rs) between annual NDVImax and SWI among sites from 1985 to 2016, while bottom panels (e-h) depict trends and correlations from 2000 to 2016. Areas that are barren or lacked adequate Landsat data for trend and correlation assessments are shown in black. Source: Berner et al., (2020) |
| Graphic Preview File | https://daac.ornl.gov/ABOVE/guides/Tundra_Greeness_Temp_Trends_Fig1.png |
| Harvest Object Id | adce0849-ab2f-4027-b21e-f12521c36274 |
| Harvest Source Id | 58f92550-7a01-4f00-b1b2-8dc953bd598f |
| Harvest Source Title | NASA Data.json |
| Homepage URL | https://doi.org/10.3334/ORNLDAAC/1893 |
| Metadata Type | geospatial |
| Old Spatial | -180.0 31.49 180.0 90.0 |
| Program Code | 026:001 |
| Source Datajson Identifier | True |
| Source Hash | add333178ef0892fad716a37436b90333773b5f106adda1cefd519bb9bf4b412 |
| Source Schema Version | 1.1 |
| Spatial | |
| Temporal | 1985-07-01T00:00:00Z/2016-08-31T23:59:59Z |
Didn't find what you're looking for? Suggest a dataset here.


