Snowstorm Database
Access & Use Information
Downloads & Resources
-
NCEI Dataset Landing Page
Landing page for the dataset.
-
NCEI Direct Download
Direct download for dataset files.
-
NCEI GIS Map Portal
GIS map application to visualize dataset layers.
-
Dataset READMETEXT
Please refer to the README file for more information about the dataset.
-
NOAA National Centers for Environmental...
11 views
NCEI home page with information, data access and contact information.
-
Global Change Master Directory (GCMD) Keywords
20 views
The information provided on this page seeks to define how the GCMD Keywords...
-
GCOS Essential Climate Variables
Overview of the GCOS Essential Climate Variables.
-
Global Change Master Directory (GCMD) Keywords
20 views
The information provided on this page seeks to define how the GCMD Keywords...
-
Global Change Master Directory (GCMD) Keywords
20 views
The information provided on this page seeks to define how the GCMD Keywords...
-
Global Change Master Directory (GCMD) Keywords
20 views
The information provided on this page seeks to define how the GCMD Keywords...
-
Global Change Master Directory (GCMD) Keywords
20 views
The information provided on this page seeks to define how the GCMD Keywords...
-
Global Change Master Directory (GCMD) Keywords
20 views
The information provided on this page seeks to define how the GCMD Keywords...
-
Global Change Master Directory (GCMD) Keywords
20 views
The information provided on this page seeks to define how the GCMD Keywords...
-
Global Change Master Directory (GCMD) Keywords
20 views
The information provided on this page seeks to define how the GCMD Keywords...
-
Northeast Snowfall Impact Scale
Product uses the Snowstorm Database for development--a precursor to the...
-
Regional Snowfall Impact Scale
Product uses the Snowstorm Database for development. It is an evolution of...
Dates
| Metadata Date | June 23, 2023 |
|---|---|
| Metadata Created Date | October 28, 2022 |
| Metadata Updated Date | September 19, 2023 |
| Reference Date(s) | November 30, 2012 (publication) |
| Frequency Of Update | asNeeded |
Metadata Source
- ISO-19139 ISO-19139 Metadata
Harvested from ncdc
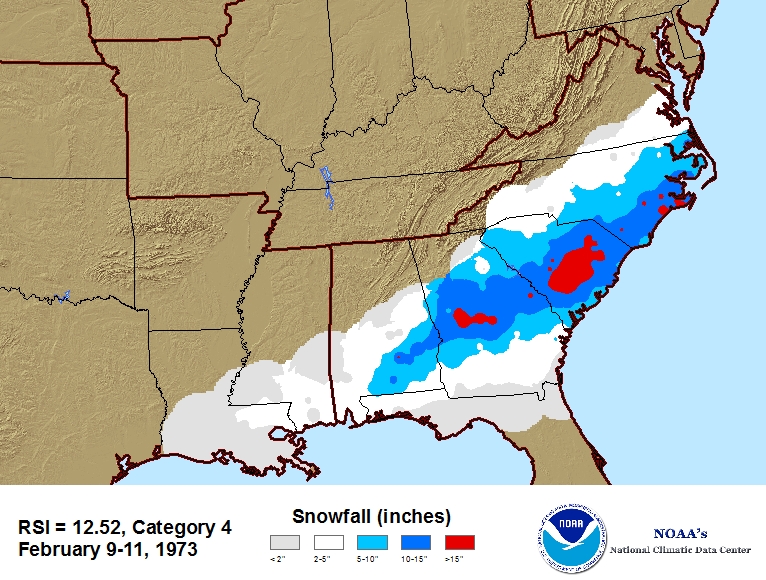
Graphic Preview

Additional Metadata
| Resource Type | Dataset |
|---|---|
| Metadata Date | June 23, 2023 |
| Metadata Created Date | October 28, 2022 |
| Metadata Updated Date | September 19, 2023 |
| Reference Date(s) | November 30, 2012 (publication) |
| Responsible Party | NOAA National Centers for Environmental Information (Point of Contact) |
| Contact Email | |
| Guid | gov.noaa.ncdc:C00464 |
| Access Constraints | Cite as: Squires, Mike(2012). Snowstorm Database [Indicate subset used]. NOAA National Centers for Environmental Information. [Access date], Distribution liability: NOAA and NCEI make no warranty, expressed or implied, regarding these data, nor does the fact of distribution constitute such a warranty. NOAA and NCEI cannot assume liability for any damages caused by any errors or omissions in these data. If appropriate, NCEI can only certify that the data it distributes are an authentic copy of the records that were accepted for inclusion in the NCEI archives., Use liability: NOAA and NCEI cannot provide any warranty as to the accuracy, reliability, or completeness of furnished data. Users assume responsibility to determine the usability of these data. The user is responsible for the results of any application of this data for other than its intended purpose. |
| Bbox East Long | -66.0 |
| Bbox North Lat | 50.0 |
| Bbox South Lat | 24.0 |
| Bbox West Long | -125.0 |
| Coupled Resource | |
| Frequency Of Update | asNeeded |
| Graphic Preview Description | RSI map based on Snowstorm Database |
| Graphic Preview File | https://www.ncei.noaa.gov/pub/data/metadata/images/C00465_RSI-image.jpg |
| Graphic Preview Type | JPEG |
| Harvest Object Id | 07942a79-1e26-4861-beeb-a0a66b537a77 |
| Harvest Source Id | 2cb3ef77-1683-4c2a-9119-dc65e50917c6 |
| Harvest Source Title | ncdc |
| Licence | Shapefiles are processed and made available as soon as possible after a snowstorm event. The database does not update on a regular basis as snowstorms arrive irregularly. |
| Lineage | The Snowfall Database uses Global Historical Climatatology Network - Daily (GHCN-D), which has automated quality control built into its processing. Once the starting and ending dates of a snowstorm are identified, daily data from GHCN-D is extracted and brought into ArcGIS. At that point an analyst removes stations that are not part of the storm. Stations that were part of the storm are checked to ensure that only days with snowfall are included in the snowfall total. The data is then checked for any stations whose total snowfall is statistically different from it's neighbors using Local Moran's Index (see documentation). Stations flagged from this test are checked for spatial consistency. It is assumed that all data is correct unless there is enough evidence otherwise. The station may be kept or rejected, but not values are changed. The analyst then looks for any stations that appear spatially inconsistent with its neighbors. Some of the factors that can make a station or stations appear spatially in consistent are topography, lake effect snow, changes in temperature during the storm (wet vs. dry snow), and spatial variability. |
| Metadata Language | eng; USA |
| Metadata Type | geospatial |
| Old Spatial | {"type": "Polygon", "coordinates": [[[-125.0, 24.0], [-66.0, 24.0], [-66.0, 50.0], [-125.0, 50.0], [-125.0, 24.0]]]} |
| Progress | onGoing |
| Spatial Data Service Type | |
| Spatial Reference System | urn:ogc:def:crs:EPSG::9822 |
| Spatial Harvester | True |
| Temporal Extent Begin | 1900-01-01 |
Didn't find what you're looking for? Suggest a dataset here.

