Mean Annual Fluxes of Carbon in Coastal Ecosystems of Eastern North America
Access & Use Information
Downloads & Resources
-
Google Scholar search resultsHTML
Search results for publications that cite this dataset by its DOI.
-
Download this datasetHTML
This link allows direct data access via Earthdata login
-
View documentation related to this datasetHTML
ORNL DAAC Data Set Documentation
-
This dataset's landing pageHTML
Data set Landing Page DOI URL
-
View documentation related to this datasetPDF
A pdf of the user guide
-
Get a related visualizationPNG
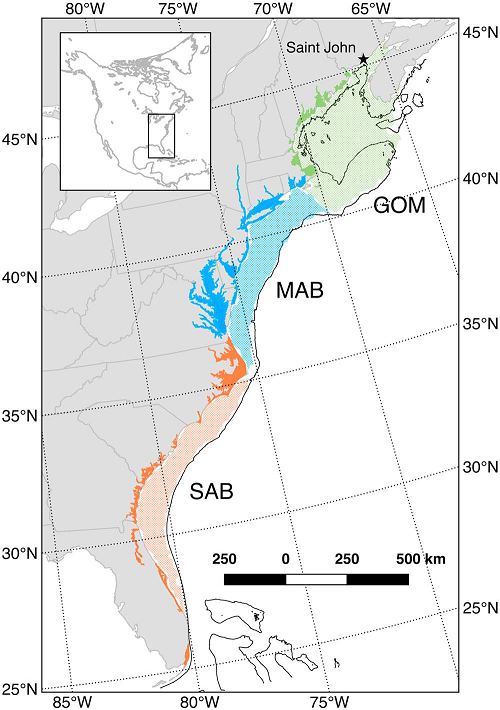
Study domain indicating locations of estuaries (darker colors) and shelf...
-
Landing PageLanding Page
Dates
| Metadata Created Date | May 30, 2023 |
|---|---|
| Metadata Updated Date | December 6, 2023 |
Metadata Source
- Data.json Data.json Metadata
Harvested from NASA Data.json
Graphic Preview

Additional Metadata
| Resource Type | Dataset |
|---|---|
| Metadata Created Date | May 30, 2023 |
| Metadata Updated Date | December 6, 2023 |
| Publisher | ORNL_DAAC |
| Maintainer | |
| Identifier | C2517679850-ORNL_CLOUD |
| Data First Published | 2018-07-13 |
| Language | en-US |
| Data Last Modified | 2023-06-12 |
| Category | NACP, geospatial |
| Public Access Level | public |
| Bureau Code | 026:00 |
| Metadata Context | https://project-open-data.cio.gov/v1.1/schema/catalog.jsonld |
| Metadata Catalog ID | https://data.nasa.gov/data.json |
| Schema Version | https://project-open-data.cio.gov/v1.1/schema |
| Catalog Describedby | https://project-open-data.cio.gov/v1.1/schema/catalog.json |
| Citation | Najjar, R.G., M. Herrmann, R. Alexander, E.W. Boyer, D.J. Burdige, D. Butman, W. Cai, E.A. Canuel, B. Chen, M. Friedrichs, R.A. Feagin, P. Griffith, A. Hinson, J.R. Holmquist, X. Hu, W.M. Kemp, K. Kroeger, A. Mannino, S.L. Mccallister, W.R. Mcgillis, M. Mulholland, C. Pilskaln, J. Salisbury, S. Signorini, P. St-laurent, H. Tian, M.A. Tzortziou, P. Vlahos, Z. Wang, and R. Zimmerman. 2018. Mean Annual Fluxes of Carbon in Coastal Ecosystems of Eastern North America. ORNL DAAC, Oak Ridge, Tennessee, USA. https://doi.org/10.3334/ORNLDAAC/1594 |
| Graphic Preview Description | Study domain indicating locations of estuaries (darker colors) and shelf waters (lighter shading) in the three subregions: the Gulf of Maine (GOM), the Mid-Atlantic Bight (MAB), and the South Atlantic Bight (SAB). The 100-m isobath is shown as a solid black line. The outline of the St. John estuary in Canada was not available, so it is indicated by a star. |
| Graphic Preview File | https://daac.ornl.gov/NACP/guides/Coastal_Carbon_Budget_NE_US_Fig1.png |
| Harvest Object Id | 5df1b3f7-3aa3-4431-ae64-222d869c4d94 |
| Harvest Source Id | 58f92550-7a01-4f00-b1b2-8dc953bd598f |
| Harvest Source Title | NASA Data.json |
| Homepage URL | https://doi.org/10.3334/ORNLDAAC/1594 |
| Metadata Type | geospatial |
| Old Spatial | -85.0 25.0 -65.0 45.0 |
| Program Code | 026:001 |
| Source Datajson Identifier | True |
| Source Hash | f8fae699f5878c0a30d6eccfe47528d5d89f8bc88b78d1ab7e08e7e76e724c79 |
| Source Schema Version | 1.1 |
| Spatial | |
| Temporal | 1976-01-01T00:00:00Z/2017-12-31T23:59:59Z |
Didn't find what you're looking for? Suggest a dataset here.

