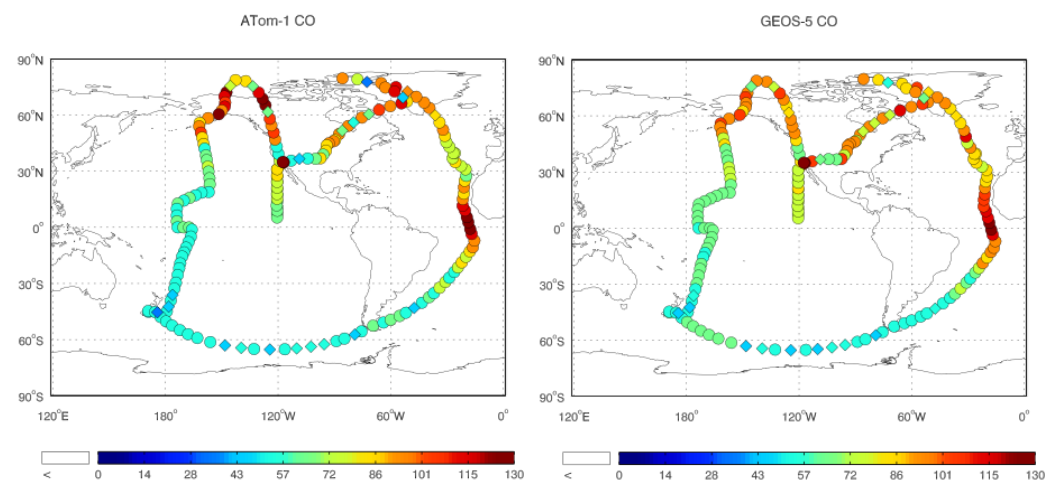
ATom: Observed and GEOS-5 Simulated CO Concentrations with Tagged Tracers for ATom-1
Access & Use Information
Downloads & Resources
-
Google Scholar search resultsHTML
Search results for publications that cite this dataset by its DOI.
-
Download this datasetHTML
This link allows direct data access via Earthdata login
-
View documentation related to this datasetHTML
ORNL DAAC Data Set Documentation
-
This dataset's landing pageHTML
Data set Landing Page DOI URL
-
Use OPeNDAP to access the dataset's dataHTML
USE SERVICE API
-
View documentation related to this datasetPDF
ATom: Observed versus simulated carbon monoxide concentrations for ATom-1...
-
Get a related visualizationPNG
CO (ppb) from the QCLS observations (left) and GEOS-5 analysis (right) for...
-
The dataset's project home pageHTML
ATom campaign page
-
View documentation related to this datasetHTML
The THREDDS location for this Collection.
-
Landing PageLanding Page
Dates
| Metadata Created Date | June 27, 2023 |
|---|---|
| Metadata Updated Date | December 7, 2023 |
Metadata Source
- Data.json Data.json Metadata
Harvested from NASA Data.json
Graphic Preview

Additional Metadata
| Resource Type | Dataset |
|---|---|
| Metadata Created Date | June 27, 2023 |
| Metadata Updated Date | December 7, 2023 |
| Publisher | ORNL_DAAC |
| Maintainer | |
| Identifier | C2704963648-ORNL_CLOUD |
| Data First Published | 2018-07-31 |
| Language | en-US |
| Data Last Modified | 2023-06-12 |
| Category | ATom, geospatial |
| Public Access Level | public |
| Bureau Code | 026:00 |
| Metadata Context | https://project-open-data.cio.gov/v1.1/schema/catalog.jsonld |
| Metadata Catalog ID | https://data.nasa.gov/data.json |
| Schema Version | https://project-open-data.cio.gov/v1.1/schema |
| Catalog Describedby | https://project-open-data.cio.gov/v1.1/schema/catalog.json |
| Citation | Strode, S.A., J. Liu, L. Lait, R. Commane, B.C. Daube, S.C. Wofsy, A. Conaty, P. Newman, and M.J. Prather. 2018. ATom: Observed and GEOS-5 Simulated CO Concentrations with Tagged Tracers for ATom-1. ORNL DAAC, Oak Ridge, Tennessee, USA. https://doi.org/10.3334/ORNLDAAC/1604 |
| Graphic Preview Description | CO (ppb) from the QCLS observations (left) and GEOS-5 analysis (right) for the ATom-1 circuit including all 11 research flight segments. The GEOS-5 CO is taken from the analysis closest to the mid-point of the flight time and interpolated to the flight track following the longitude, latitude and pressure given in observations. Both model forecast and ATom measurements are averaged into a sample rate of one per 360-second. Data in the troposphere are plotted in a circle; data in the stratosphere are plotted in a diamond (from Strode et al. 2018). |
| Graphic Preview File | https://daac.ornl.gov/ATOM/guides/ATom_CO_GEOS_Fig1.png |
| Harvest Object Id | 688c8195-7612-49f7-a3cd-04fddf75a1eb |
| Harvest Source Id | 58f92550-7a01-4f00-b1b2-8dc953bd598f |
| Harvest Source Title | NASA Data.json |
| Homepage URL | https://doi.org/10.3334/ORNLDAAC/1604 |
| Metadata Type | geospatial |
| Old Spatial | -180.0 -65.33 179.98 80.01 |
| Program Code | 026:001 |
| Source Datajson Identifier | True |
| Source Hash | 52235436d2efb11f254bc6cbc9eae96935b081efcdd99d5733e8ead2a4758c4a |
| Source Schema Version | 1.1 |
| Spatial | |
| Temporal | 2016-07-29T14:33:05Z/2016-08-23T20:00:45Z |
Didn't find what you're looking for? Suggest a dataset here.

